The velocity of an object is defined as the displacement (covered by it) per unit time in a particular direction.
It is a vector quantity, i.e., it has both magnitude and direction.
It is denoted by the symbol v, has an SI Unit of m/sec, and its dimensions are [LT-1]
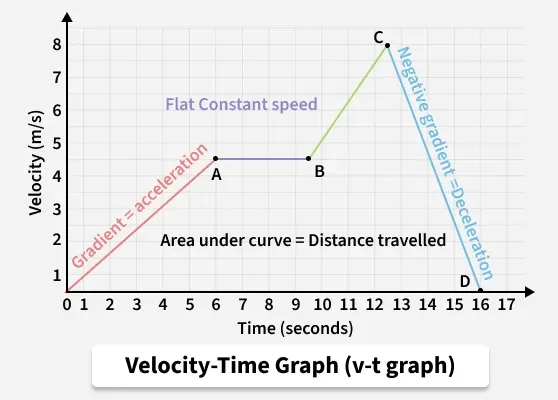
A Velocity-Time graph shows how an object's velocity changes over time when it's moving in a straight line. The graph has velocity on the vertical axis and time on the horizontal axis.
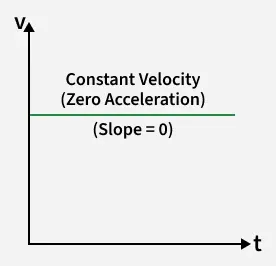
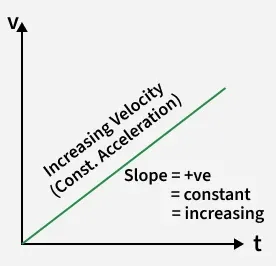
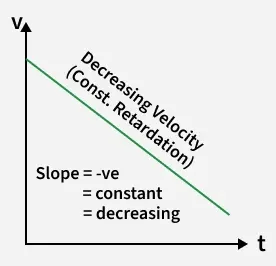
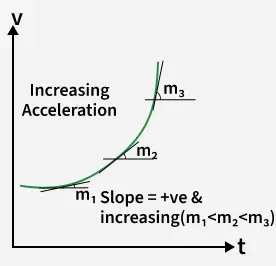
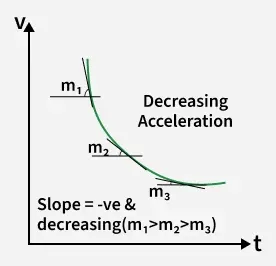
Depending upon the different types of velocities, for example, an object may have a constant velocity, increasing velocity, or decreasing velocity, it can easily be determined if the object is accelerating, decelerating, or not accelerating at all.
Key Concepts
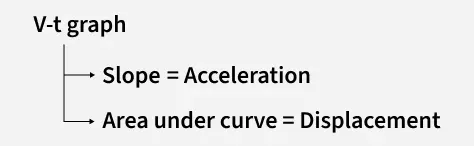
1. The velocity–time graph provides two fundamental relationships in uniformly accelerated motion:
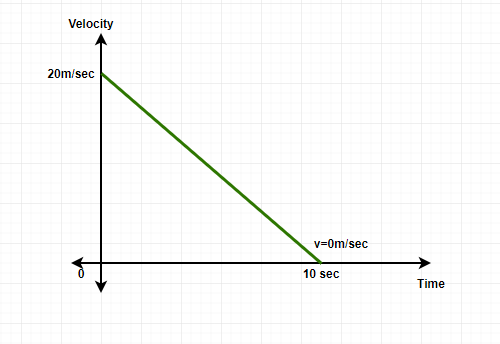
Question 1: Draw the graph for an object starting at a velocity of 20m/sec and the final velocity becomes 0 m/sec at T=10th second. The object is decelerating in nature.
The graph will have a negative slope since the object is deceleration in nature.
Velocity-time graph
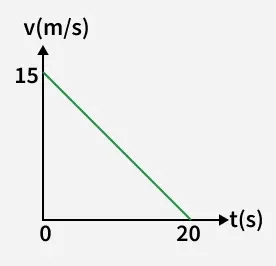
Question 2: An object with an initial velocity of 15m/sec is decelerating and ultimately coming to a stop at T= 20 seconds, Find the Displacement covered by the object.
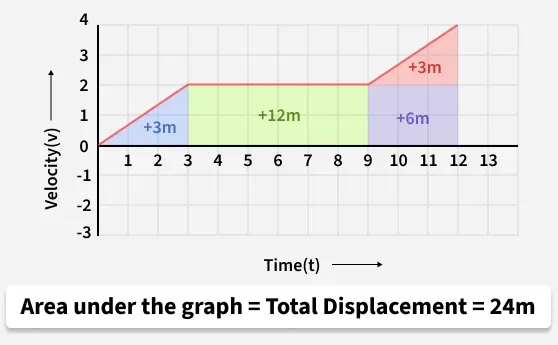
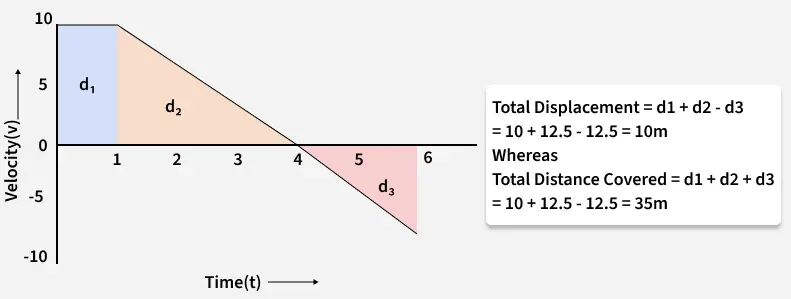
The displacement of the object can be found out by finding the area of the velocity-time graph.
Area of the right angle triangle= Displacement of the object= \frac{1}{2} × Base × Height
Displacement= \frac{1}{2}× 20× 15
Displacement = 150 meters.
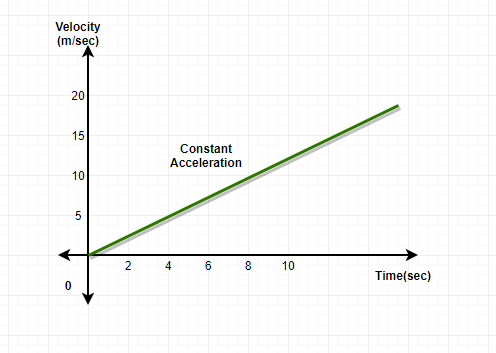
Question 3: Find the Acceleration of the object which is constant in nature, The graph for the object's velocity is given below.
The acceleration in the velocity-time graph is found out through the slope, the slope is the ratio of the value at y-axis and x-axis, solving this will easily give the value of acceleration of the object.
At time T= 8 sec, the value of the velocity of the object is 8 m/sec.
Hence, the slope of the graph at T= 10 sec will be,
Slope of the graph= Acceleration of the object = 8/10
Acceleration = 0.8 m/sec2
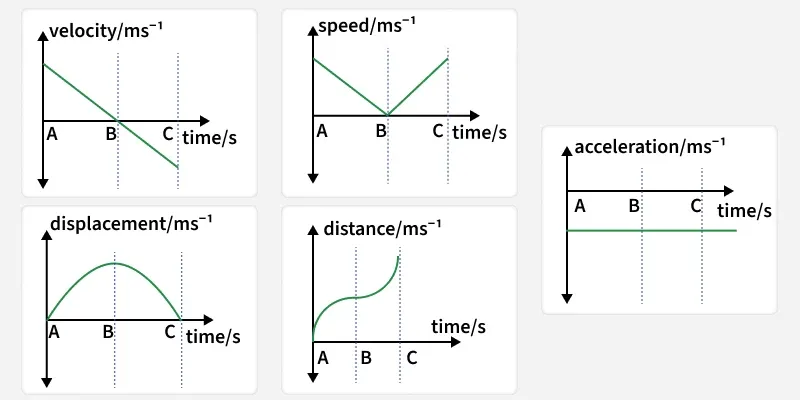
Question 4: A Ball is thrown upwards and then after reaching a particular height it come down as shown in the figure Draw the following graph for the above case:-
Distance - Time graph
Displacement - Time graph
Speed - Time graph
Velocity - Time graph
Acceleration -Time graph
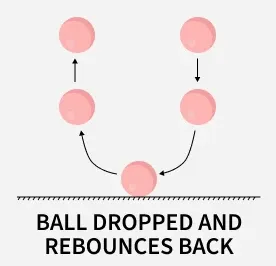
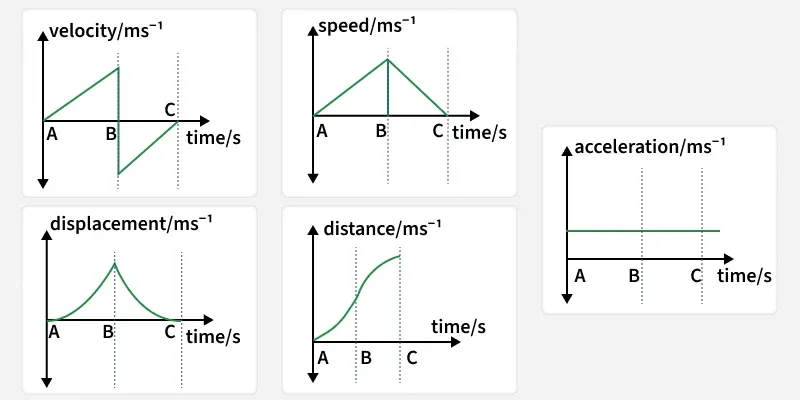
Question 5: A Ball is dropped downwards and then after colliding with the ground it rebounds back as shown in the figure Draw the following graph for the above case:-
Distance - Time graph
Displacement - Time graph
Speed - Time graph
Velocity - Time graph
Acceleration -Time graph
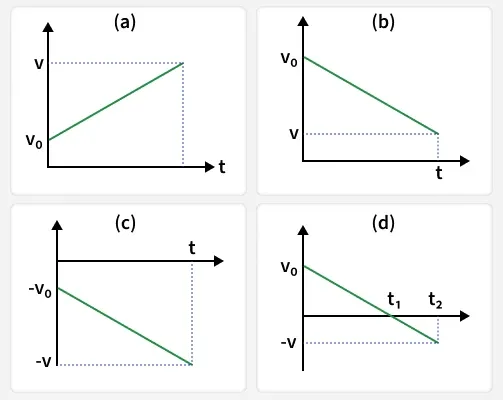
Question 6: Draw the Following Velocity-time graph for the following motions with constant acceleration:-
Motion in positive direction with positive acceleration
Motion in positive direction with negative acceleration,
Motion in negative direction with negative acceleration,
Motion of an object with negative acceleration that changes direction at time t₁. Between times 0 to t, it moves in positive x - direction and between t, and t, it moves in the opposite direction.
Unsolved Questions
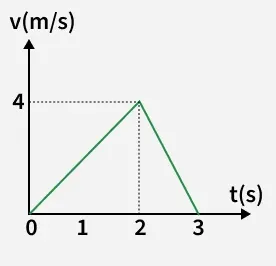
Q1. The velocity versus time graph of a body moving in a straight line is as shown in the figure below, Find
The distance covered by the body in 0 to 3s also
The acceleration of the body in 0 to 2s
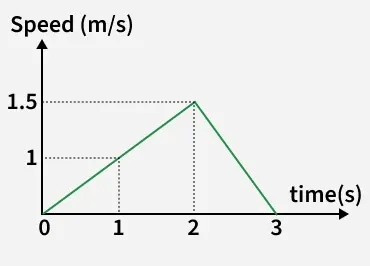
Q2. The speed-time graph of a particle moving along a solid curve is shown below. The distance traversed by the particle from t = 0 to t = 3 is ?
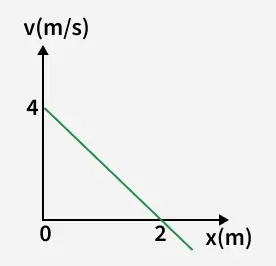
Q3. The velocity (v) of a particle moving along x-axis varies with its position x as shown in figure. Find the acceleration (a) of particle varies with position (x)? Hint:(Find the Equation between a and x)