RAGAS (Retrieval-Augmented Generation Assessment Suite) is an open-source evaluation framework developed by Hugging Face to quantitatively assess the quality of RAG systems. It measures how well a system retrieves and utilises external context to generate accurate, faithful and relevant responses. Unlike traditional metrics that only compare text similarity, RAGAS evaluates the entire RAG pipeline i.e from context retrieval to answer generation hence helping developers to identify performance bottlenecks across the workflow.
- Answer Relevancy: Measures how closely the generated response matches the user’s query intent.
- Faithfulness: Evaluates whether the response stays true to the retrieved evidence.
- Context Precision: Assesses how relevant the retrieved chunks are to the query.
- Context Recall: Determines whether all necessary information was retrieved.
- Evaluation Dataset: Represents the structured input including questions, contexts, responses and reference answers used for metric computation.
Implementation
Let's implement the system to understand how the evaluation happens.
Step 1: Installing Dependencies
We need to install the required packages such as ragas, datasets, and evaluate.
!pip install -qU ragas datasets evaluate openai matplotlib pandas
Step 2: Importing Libraries
We need to import the required libraries such as pandas, matplotlib, datasets, openai, ragas.
import pandas as pd
import matplotlib.pyplot as plt
from datasets import Dataset
from ragas.metrics import answer_relevancy, faithfulness, context_precision, context_recall
from ragas import evaluate
from openai import OpenAI
Step 3: Initializing LLM
We will initialize the LLM.
llm = OpenAI(api_key="your_openai_api_key", model="gpt-4o-mini")
Step 4: Prepare Evaluation Dataset
We build a structured dataset with key RAG components:
- user_input: the query
- retrieved_contexts: retrieved evidence
- response: generated answer
- reference: the ground truth
data = {
    "user_input": [
        "What is LangChain?",
        "Who developed ChromaDB?"
    ],
    "retrieved_contexts": [
        ["LangChain is an open-source framework for developing applications powered by large language models."],
        ["ChromaDB is a vector database developed by Chroma, an open-source embedding database company."]
    ],
    "response": [
        "LangChain is a framework for developing applications using LLMs.",
        "ChromaDB was developed by Chroma, an open-source company."
    ],
    "reference": [
        "LangChain is an open-source framework for building applications using large language models.",
        "ChromaDB was built by the Chroma team as an open-source vector database."
    ]
}
dataset = Dataset.from_dict(data)
Step 5: Evaluate RAG System
We will evaluate the system on all four RAGAS metrics.
results = evaluate(
    dataset=dataset,
    metrics=[answer_relevancy, faithfulness,
             context_precision, context_recall],
    llm=llm
)
Step 6: Display the Result
We will display the obtained results.
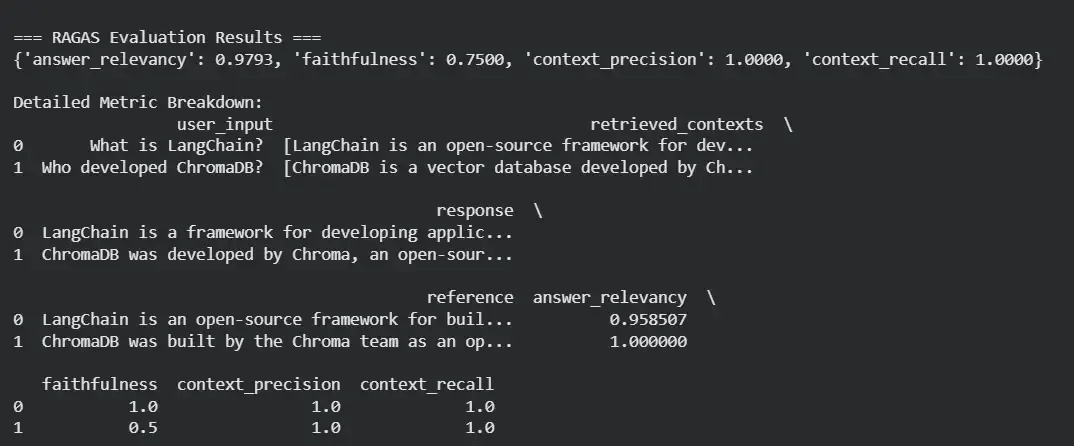
print("\n=== RAGAS Evaluation Results ===")
print(results)

df = results.to_pandas()
print("\nDetailed Metric Breakdown:\n", df)
Output:
Step 7: Visualize Results
We will visualize the obtained results for better understanding,
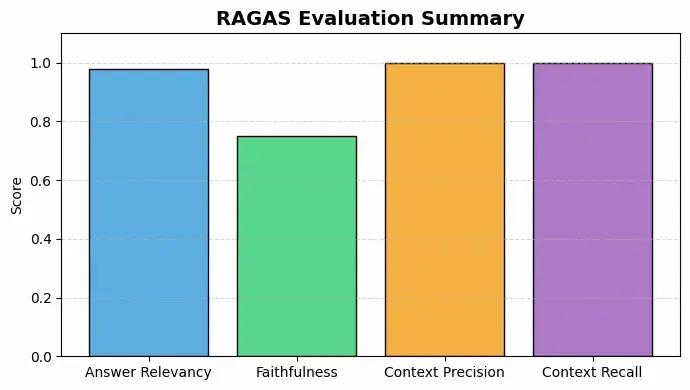
a. Bar Chart
metrics = {
    "Answer Relevancy": results["answer_relevancy"],
    "Faithfulness": results["faithfulness"],
    "Context Precision": results["context_precision"],
    "Context Recall": results["context_recall"]
}

plt.figure(figsize=(7, 4))
plt.bar(metrics.keys(), metrics.values(), color=[
        "#5DADE2", "#58D68D", "#F5B041", "#AF7AC5"], edgecolor='black')
plt.title("RAGAS Evaluation Summary", fontsize=14, fontweight='bold')
plt.ylabel("Score")
plt.ylim(0, 1)
plt.show()
Output:
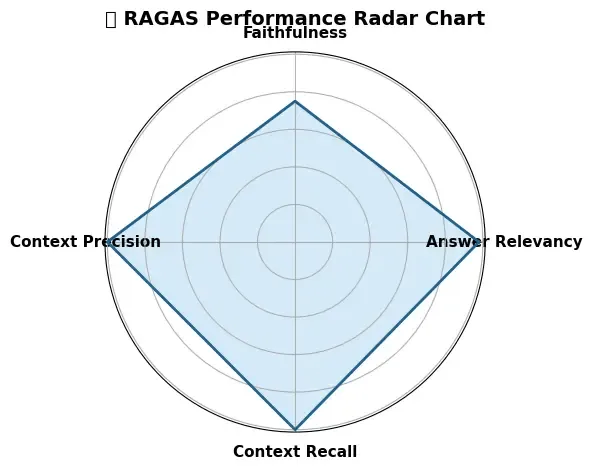
b. Radar Chart
import numpy as np

labels = list(metrics.keys())
values = list(metrics.values())
values += values[:1]
angles = np.linspace(0, 2 * np.pi, len(labels) + 1)

plt.figure(figsize=(5, 5))
ax = plt.subplot(111, polar=True)
ax.plot(angles, values, 'o-', linewidth=2)
ax.fill(angles, values, alpha=0.25)
ax.set_yticks([0.2, 0.4, 0.6, 0.8, 1.0])
ax.set_xticks(angles[:-1])
ax.set_xticklabels(labels)
plt.title("RAGAS Metric Radar Chart", size=13)
plt.show()
Output:
You can d ownload source code from here.
Advantages
- Holistic Evaluation: Analyzes retrieval and generation phases together.
- Model-Agnostic: Works with any RAG pipeline like LangChain, LlamaIndex, etc.
- Semantic Understanding: Uses LLMs for context-aware comparison not keyword matching.
- Identifies Weak Links: Highlights exactly where your pipeline fails i.e retrieval vs generation.
- Quantitative & Reproducible: Offers standardized metrics for consistent benchmarking.
Limitations
- Dependent on LLM Quality: Inaccurate evaluations if the chosen model misinterprets meaning.
- High Cost & Latency: Using external LLMs for scoring can be expensive and slow.
- Limited Multilingual Support: Currently optimized for English datasets.
- Doesn’t Handle Multi-turn Contexts Well: Primarily designed for single-turn QA.
- Requires Quality References: Results depend heavily on good reference answers.