A hierarchy in Tableau is used to arrange related dimensions into different levels so users can easily drill down from summarised data to more detailed views, making analysis more structured and interactive. It allows analysts to explore data step by step, such as moving from a country level to a state and then to a city, without creating multiple separate charts.
- Organises data into logical levels
- Enables drill-down and roll-up analysis
- Makes large datasets easier to explore
- Improves dashboard interactivity
- Supports clearer and more meaningful insights
Implementation
Let us understand how Hierarchy can be used:
Dataset used can be downloaded from here.
- Open the Tableau tool and connect a dataset to it.
- Drag and drop the one sheet of the connected dataset.
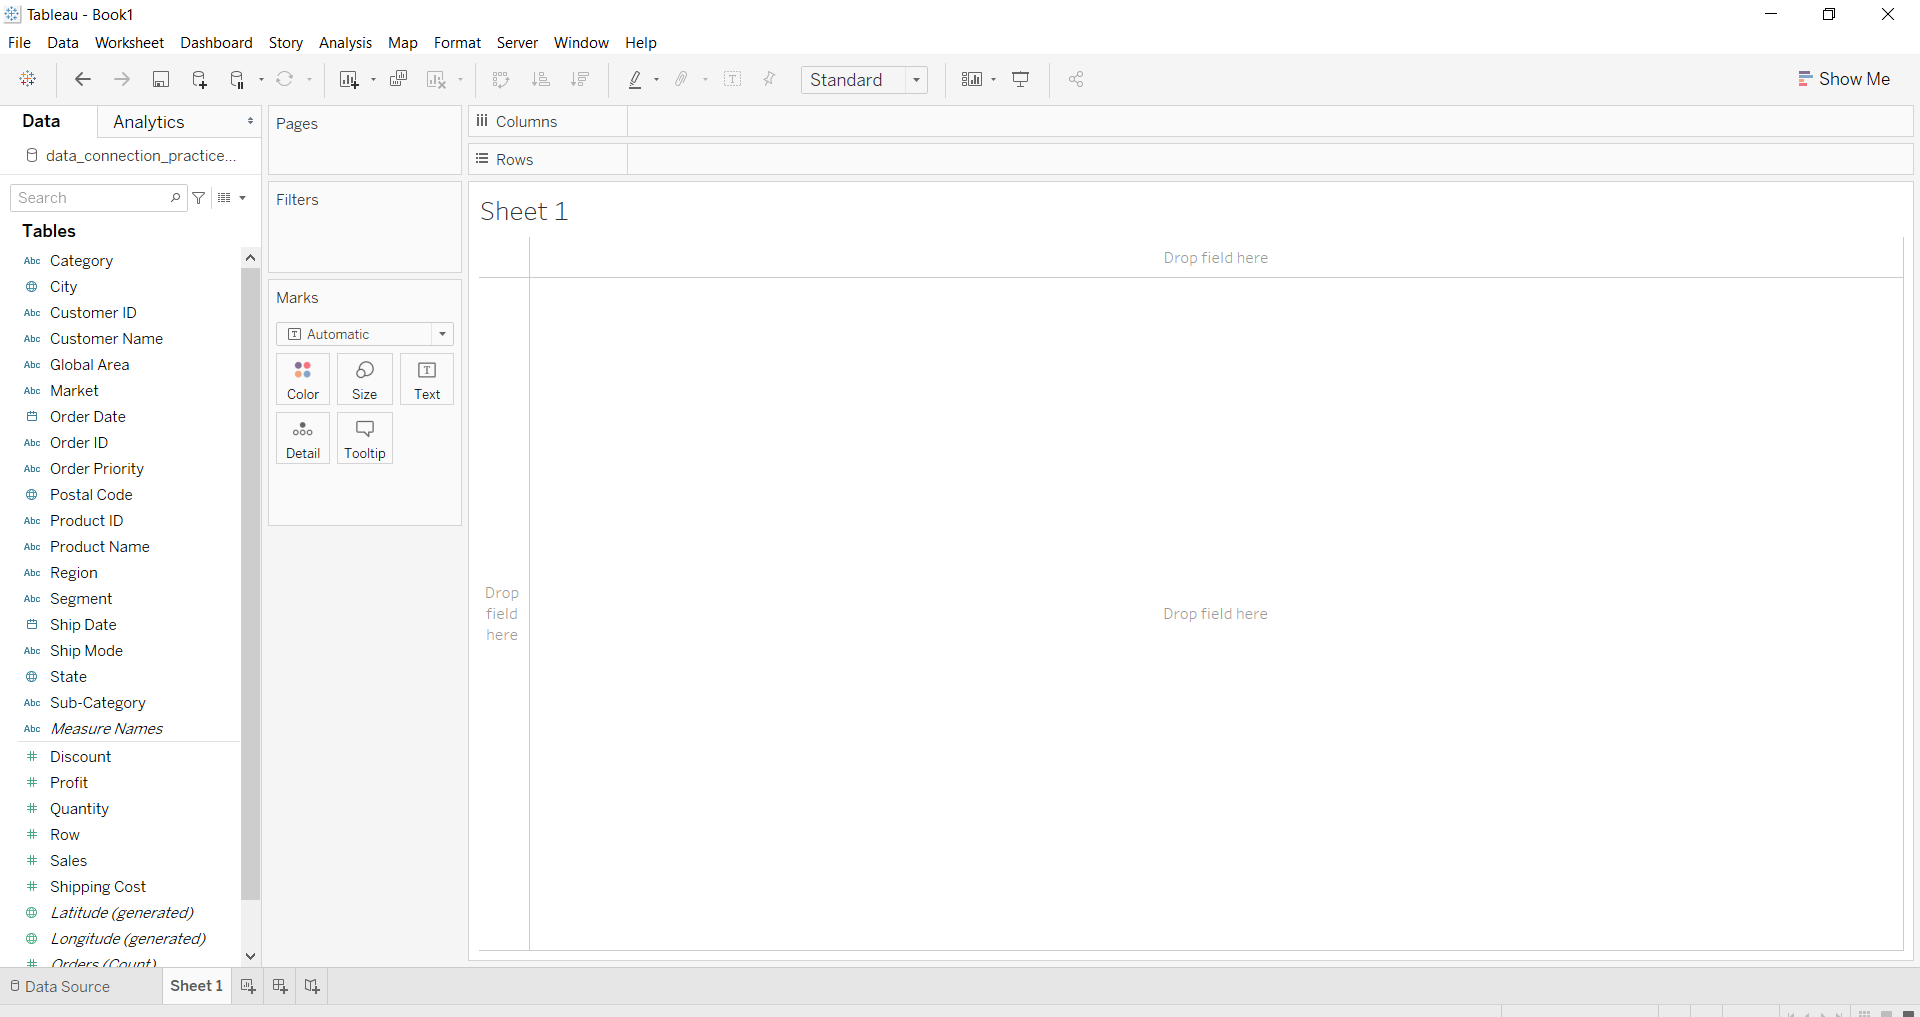
- Click on sheet1 to open the Tableau worksheet.
- On clicking Sheet1, you will get the whole dataset attributes on the left side and a worksheet for work
Creating Hierarchy
- By click hierarchy
- By Drag and drop
- By selecting fields and create
Removing Hierarchy
- By selecting fields and click on remove hierarchy