A Choropleth Map is a thematic map where geographic regions are shaded or colored based on a data value. In Tableau, choropleth maps are commonly used to visualize how a measure such as sales, profit, or population varies across locations like states or countries. Choropleth maps are useful for:
- Visualising the geographic distribution of data
- Comparing values across regions easily
- Identifying high and low performing areas
- Enhancing dashboards with spatial insights
Creating Choropleth Map in Tableau
Tableau makes it easy to create a choropleth map using built-in geographic roles. Below are the steps to create a choropleth map using Tableau.
Note: For this article, the dataset used is Sample_Superstore.xls. To download click here.
Step 1: Create the Base Map
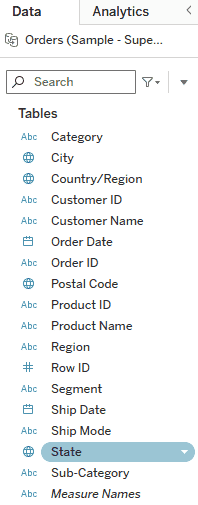
In the Data pane, double-click on the State field. Tableau will automatically recognize the geographic role and generate a map view.
Step 2: Add Color Based on Sales
From the Data pane, drag Sales to the Color shelf in the Marks card.
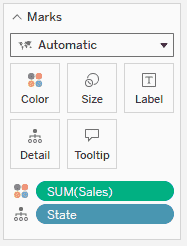
Tableau will now shade each state based on the total sales value, creating a choropleth effect.
Step 3: Display Sales Values on the Map
To show exact sales values for each state, drag Sales again to the Label shelf in the Marks card.
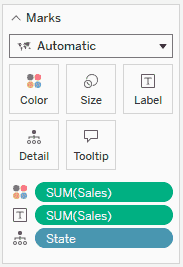
The map will now display SUM(Sales) for each state, making the visualization more informative.
Final Output
After completing the above steps, you will have a Choropleth Map that visually represents state-wise sales performance.
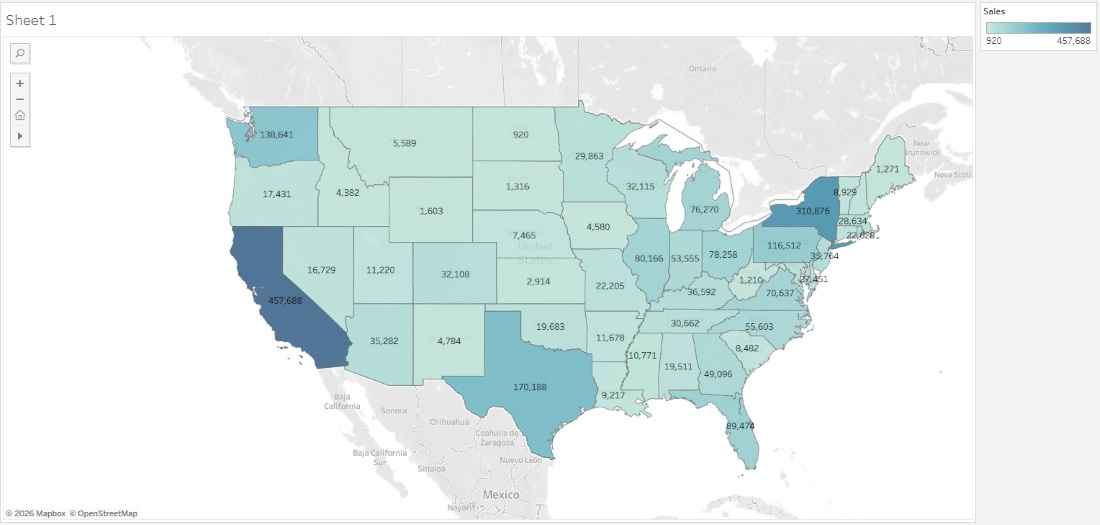
- Each state is shaded based on SUM(Sales), making it easy to identify high and low performing regions.
- Darker shades indicate higher sales, while lighter shades represent lower sales.
- Sales values are displayed directly on the map, providing quick numeric insight along with geographic context.