Software testing metrics are measurable indicators used to evaluate the progress, quality, and efficiency of the testing process. They enable continuous improvement through data-driven decision-making.
- Measure progress, quality, and efficiency of testing activities.
- Help in monitoring and improving the testing process.
- Support data-driven decision-making for better software quality.
Guidelines for Selecting Testing Metrics
It is important to choose appropriate testing metrics for effective measurement. The following points should be considered:
- Identify the target audience before defining metrics.
- Clearly define the objective of each metric.
- Align metrics with specific project requirements.
- Evaluate the cost or effort required to collect and maintain metrics.
- Ensure metrics match the current phase of the project lifecycle.
Test Metrics Life Cycle
The test metrics life cycle represents the different stages involved in defining, collecting, analyzing, and reporting software testing metrics. It ensures that metrics are effectively used for monitoring and improving the testing process.
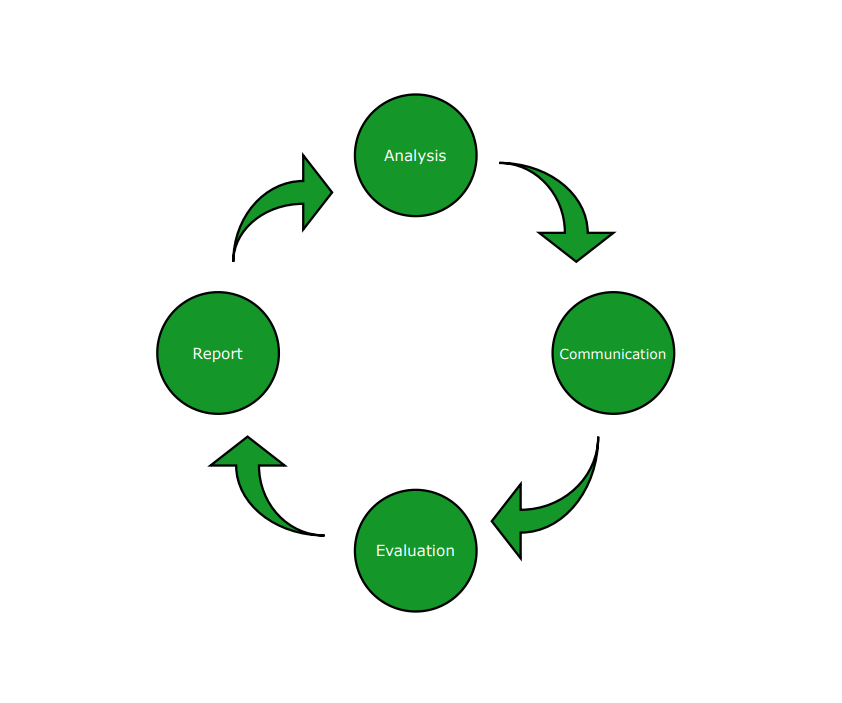
- Analysis: In this stage, relevant metrics are identified based on project requirements. The QA team defines which metrics need to be measured and why they are important.
- Communicate: Stakeholders and the testing team are informed about the selected metrics and their purpose. The team is also guided on the data to be collected for accurate measurement
- Evaluation: In this phase, required data is collected, validated, and analyzed. The collected data is then used to calculate the defined metrics.
- Report: The final results are documented and shared with stakeholders. Feedback is collected to improve future testing activities and metric usage.
Types of Software Testing Metrics
Software testing metrics are broadly divided into three categories:
- Process Metrics: Process metrics measure the efficiency and effectiveness of testing activities throughout the software development lifecycle (SDLC).
- Product Metrics: Product metrics focus on the quality, performance, and reliability of the software product and help identify weaknesses to improve overall quality.
- Project Metrics: Project metrics are used to estimate and monitor project resources, cost, productivity, delivery timelines, and defect levels.
Manual Test Metrics
Manual testing is performed step-by-step by QA professionals who execute test cases and observe system behavior without using automation tools. Although time-consuming, it allows testers to handle complex, judgment-based scenarios that automated testing cannot easily replicate.
Types of Manual Test Metrics
1. Base Metrics : Base metrics are the raw data collected during the design and execution of test cases. This data is used to generate project status reports for test leads and project managers.
- Total number of test cases written
- Total number of test cases executed
2. Calculated Metrics: Calculated metrics are derived from base metrics. They are analyzed and converted into meaningful information to track project progress at different levels such as module, tester, or overall project level.
These metrics help teams make informed decisions and support improvements in the software development lifecycle (SDLC).
Other Important Metrics
Beyond the three core categories, several specific metrics play a significant role in day-to-day testing:
- Defect Metrics: Defect metrics help evaluate different aspects of software quality such as functionality, performance, usability, compatibility, and stability. They provide insight into the overall health of the product.
- Schedule Adherence: Schedule adherence measures the difference between planned and actual schedule versus actual execution time of project activities.
- Defect Severity: Defect severity indicates the impact of a defect on the system. It helps developers understand how seriously a defect affects the software quality.
- Test Case Efficiency: Test case efficiency measures how effectively test cases are able to detect defects in the application.
- Defect Finding Rate: Defect detection rate measures how quickly and effectively defects are discovered over time.
- Defect Fixing Time: Defect fixing time is the average time taken by developers to fix a reported defect.
- Test Coverage: Test coverage measures the extent to which the application has been tested. It ensures that all requirements and functionalities are properly verified.
- Defect Cause: Defect cause identifies the root reason behind defects and helps prevent similar issues in the future.
Formula for Test Metrics
The following formulas are used to calculate the most commonly tracked software testing metrics. All values are expressed as percentages unless otherwise stated.
1. Test Cases Executed (%) : Measures how much of the planned testing has been carried out.
(Test cases executed ÷ Total test cases written) × 100
2. Test Case Effectiveness (%): Measures how efficiently test cases are finding defects.
(Number of defects detected ÷ Number of test cases executed) × 100
3. Passed Test Cases (%): Indicates the proportion of executed tests that passed successfully.
(Test cases passed ÷ Test cases executed) × 100
4. Failed Test Cases (%): Measures the proportion of executed tests that failed.
(Test cases failed ÷ Test cases executed) × 100
5. Blocked Test Cases (%): Tracks the proportion of tests that could not be executed due to dependencies or blockers.
(Test cases blocked ÷ Test cases executed) × 100
6. Fixed Defects (%): Measures the proportion of reported defects that have been resolved.
(Defects fixed ÷ Total defects reported) × 100
7. Accepted Defects (%): Measures the proportion of reported defects validated as genuine by the development team.
(Defects accepted by dev team ÷ Total defects reported) × 100
8. Defects Deferred (%): Measures the proportion of defects postponed to a future release.
(Defects deferred ÷ Total defects reported) × 100
9. Rework Effort Ratio (%): Measures how much of the team's effort is spent correcting previous work rather than progressing.
(Actual rework effort in phase ÷ Total actual effort in phase) × 100
Example: Software Test Metrics Calculation
The following example demonstrates how to calculate key metrics from real test data.
| Metric | Value |
|---|---|
| Total requirements | 5 |
| Avg. test cases per requirement | 40 |
| Total test cases written | 200 |
| Test cases executed | 164 |
| Passed test cases | 100 |
| Failed test cases | 60 |
| Blocked test cases | 4 |
| Unexecuted test cases | 36 |
| Total defects | 20 |
| Accepted defects | 15 |
| Deferred defects | 5 |
| Defects fixed | 12 |
Calculated Results
- Test Cases Executed (%): (164 ÷ 200) × 100 = 82% 82% of planned test cases were executed, leaving 18% unrun — a potential coverage risk.
- Test Case Effectiveness (%): (20 ÷ 164) × 100 = 12.2% Each 100 test cases executed found approximately 12 defects, indicating moderate detection efficiency.
- Failed Test Cases (%): (60 ÷ 164) × 100 = 36.59% Over a third of executed tests failed, suggesting significant quality issues in the build under test.
- Blocked Test Cases (%): (4 ÷ 164) × 100 = 2.44% A small proportion of tests were blocked — a healthy sign that dependencies were mostly resolved.
- Fixed Defects (%): (12 ÷ 20) × 100 = 60% Only 60% of identified defects were fixed, meaning 8 known issues remain open heading toward release.
- Accepted Defects (%): (15 ÷ 20) × 100 = 75% 75% of reported defects were validated as genuine by the development team.
- Defects Deferred (%): (5 ÷ 20) × 100 = 25% 25% of defects were deferred to a future release, which should be tracked carefully to avoid accumulation of technical debt.