In mathematics, sine and cosine functions are fundamental tools used to describe oscillations and waves, which are found everywhere from sound waves to light waves. One important concept related to these functions is phase shift, which refers to the horizontal movement of a sine or cosine wave along the x-axis. A phase shift occurs when the wave starts at a different point than usual, essentially shifting its position either to the left or right.
In this article, we will discuss Phase Shift of a Sine and Cosine Function in detail.
In trigonometry, phase shift refers to the horizontal translation of a trigonometric graph, such as sine or cosine. It describes how much the graph is shifted left or right along the x-axis
The general form of a sine or cosine function is:
y = a ⋅ sin(bx + c) + d
or
y = a ⋅ cos(bx + c) + d
In these equations:
a controls the amplitude (vertical stretch).
b affects the period (horizontal stretch or compression).
c causes the phase shift (horizontal shift).
d shifts the graph vertically.
Sine and Cosine Functions
The general forms of the sine and cosine functions are:
Sine Function: y=sin(x)
Cosine Function: y=cos(x)
These functions repeat their values in the periodic manner with the basic period of 2π. The general form for the sine and cosine functions with phase shift is:
Sine Function with Phase Shift: y = sin(x − ϕ)
Cosine Function with Phase Shift: y = cos(x − ϕ)
Where ϕ represents the phase shift.
How Phase Shift Affects the Graph
The phase shift is given by the ϕ in the equations above. The sign of the ϕ determines the direction of the shift:
Positive Phase Shift: The graph shifts to the right.
Negative Phase Shift: The graph shifts to the left.
Solved Example of Phase Shift of a Sine and Cosine Function
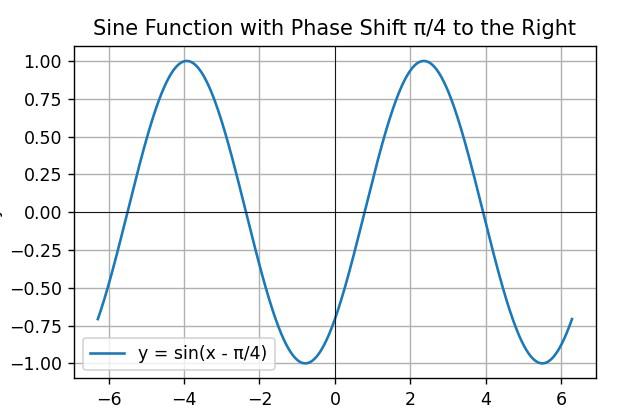
Example 1: Reflect the sine function y = \sin\left(x - \frac{\pi}{4}\right) and plot the graph.
Solution:
The phase shift is \frac{\pi}{4} units to the right.
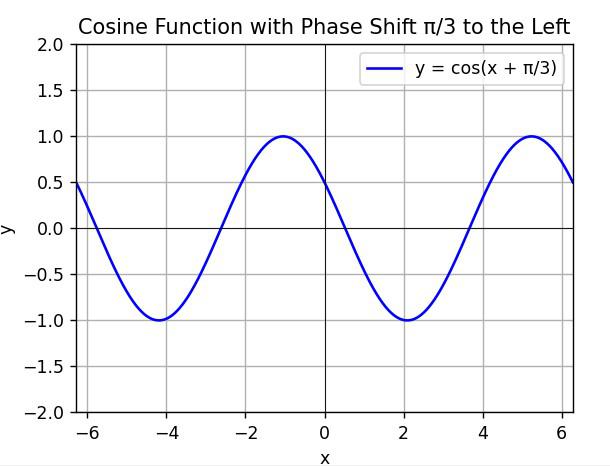
Example 2: Reflect the cosine function y = \cos\left(x + \frac{\pi}{3}\right) and plot the graph.
Solution:
The phase shift is \frac{\pi}{3} units to the left.
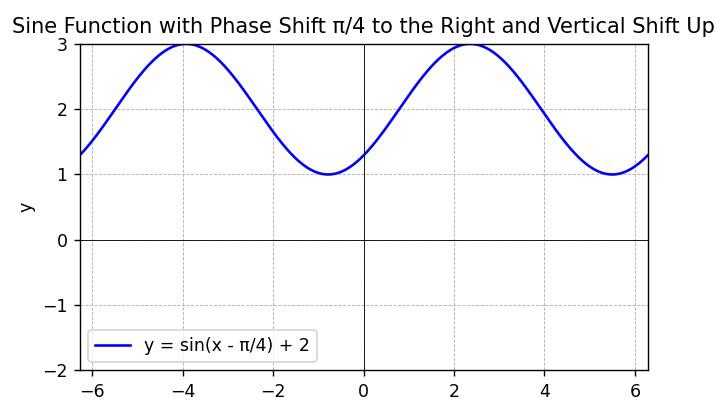
Example 3: Reflect the sine function y = \sin\left(x - \frac{\pi}{4}\right) + 2 and plot the graph.
Solution:
The phase shift is \frac{\pi}{4} units to the right and there is an additional vertical shift of the 2 units up.
Example 4: Reflect the cosine function y = 3 \cos\left(x - \frac{\pi}{6}\right) and plot the graph.
Solution:
The phase shift is \frac{\pi}{6} units to the right and amplitude is 3.
Example 5: Reflect the function y = -\sin(2x + \pi) and plot the graph.
Solution:
The phase shift is -\pi and the frequency is doubled with an amplitude of -1.
Practice Questions on Phase Shifts
Q1: How does a phase shift affect the position of the peak in a sine function?
Q2: If a cosine function is shifted 3 units to the right what is the phase shift?
Q3: What happens to the graph of y = \cos\left(x - \frac{\pi}{2}\right) compared to y = \cos(x)?
Q4: How would you graph a sine function with the phase shift of -\frac{\pi}{4}?
Q5: What is the effect of a positive phase shift on the cosine function y = \cos(x - \phi)?
Q6: If y = \sin\left(x + \frac{\pi}{2}\right) where does the peak of the sine function shift?
Q7: How do phase shifts interact with the vertical shifts in trigonometric functions?
Q8: For y = 2 \sin\left(x - \frac{\pi}{3}\right) what is the amplitude and how is the graph shifted?
Q9: Explain the difference in phase shifts between the y = \cos\left(x - \frac{\pi}{6}\right) and y = \cos\left(x + \frac{\pi}{6}\right).
Q10: How would you adjust the phase shift to make the sine function y = \sin(x) start at x = \pi?
Conclusion
Phase shifts in sine and cosine functions are essential for the understanding how these periodic functions are displaced horizontally. By mastering phase shifts we can accurately model and analyze the periodic behaviors in the various scientific and engineering fields. Understanding these shifts enhances problem-solving the abilities and aids in interpreting complex waveforms and signals.