Negatively Skewed Distribution: When analyzing data, it's crucial to recognize the shape and skewness of the distribution. If you're working with income data, exam scores, or other important metrics, knowing what a negatively skewed distribution looks like can be highly informative. This type of data distribution is common in various contexts and can reveal significant insights.
In this article, we'll explore what it means when your data is negatively skewed, and look at some examples, causes, characteristics, and central tendencies of this kind of distribution.
Table of Content
- What is a Negatively Skewed Distribution?
- Negatively Skewed Distribution: Characteristics
- Negatively Skewed Distribution: Solved Example
- Negatively Skewed Distribution: Causes
- Mean and Median in Negatively Skewed Distribution
- Negatively Skewed Distribution: Central Tendency
- Conclusion
- FAQs on Negatively Skewed Distribution
What is a Negatively Skewed Distribution?
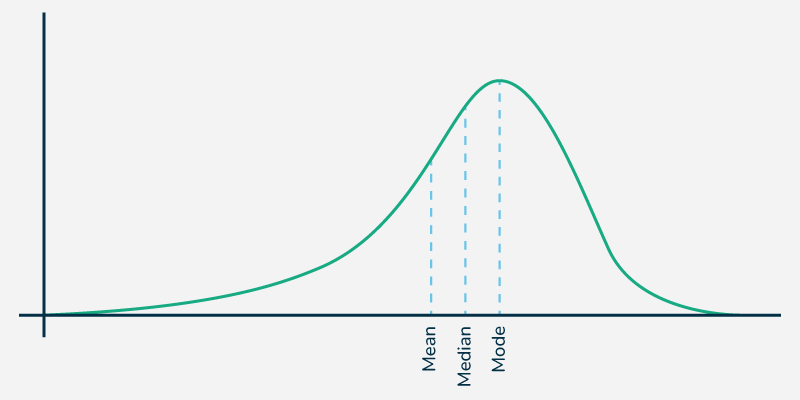
A negatively skewed distribution, also known as a left-skewed distribution, is one where most of the data is clustered on the right side of the graph, with a long tail extending to the left. In this distribution, the mean, median, and mode are typically lower, with the mean being the lowest value. This distribution indicates that the majority of the data points are higher, with fewer lower values pulling the tail to the left.
Characteristics of Negatively Skewed Distribution
Some of the common characteristics of negatively skewed distribution are:
- In a negatively skewed distribution, the data is concentrated on the right, creating a long left tail. The mean is usually lower than the median and mode due to the presence of outliers on the lower end of the data range.
- Several factors can lead to this distribution, such as income inequality, extreme low values in data, and specific conditions in finance or exam results.
- In a negatively skewed distribution, the mean is less than the median. This happens because the few lower values pull the mean downward, while the median remains closer to the majority of data points.
Negatively Skewed Distribution: Solved Example
Consider a scenario where exam scores are negatively skewed. Most students score high marks, with only a few scoring low. Here’s an example dataset:
| Score | Number of Students |
|---|---|
| 95 | 10 |
| 90 | 15 |
| 85 | 20 |
| 80 | 30 |
| 75 | 40 |
| 70 | 25 |
| 65 | 10 |
| 60 | 5 |
| 55 | 3 |
| 50 | 2 |
To determine if this distribution is negatively skewed, calculate the mean, median, and mode:
- Mean:
\text{Mean} = \frac{(95 + 90 + 85 + 80 + 75 + 70 + 65 + 60 + 55 + 50)}{10} = 72.5 - Median: The median is the middle value when the numbers are arranged in order. For this dataset:
\text{Median} = 77.5 - Mode: The mode is the most frequently occurring value, which is 75.
Therefore:
This pattern, where the mean is less than the median, indicates a negatively skewed distribution.
Negatively Skewed Distribution: Causes
Several factors can cause a negatively skewed distribution:
- Income Inequality: When a small group earns significantly less than the majority, it pulls the distribution to the left.
- Extreme Low Values: If a few data points are much lower than the rest, they create a long left tail in the distribution.
- Risky Investments: In finance, investments with higher risks and lower returns can result in a negatively skewed distribution.
- Test Scores: When most students perform well but a few score very low, the distribution is negatively skewed.
Mean and Median in Negatively Skewed Distribution
In a negatively skewed distribution, the mean is typically lower than the median because the few lower values drag the mean down. The median, which is the middle value, remains closer to the majority of the data points.
For example, consider the numbers 50, 51, 52, and 30. This set is negatively skewed because the data is spread out with a low number.
- Mean: The average is 45.75 (calculated as (50+51+52+30)/4(50 + 51 + 52 + 30)/4(50+51+52+30)/4).
- Median: The median is 50.5 (calculated as the average of the 2nd and 3rd values, (51+50)/2(51+50)/2(51+50)/2).
Since the mean (45.75) is less than the median (50.5), the data is negatively skewed.
Negatively Skewed Distribution: Central Tendency
Central tendency refers to the mean, median, and mode of the distribution. In a negatively skewed distribution, the mean is less than the median, and the median is less than the mode:
- Mean: The average of all values.
- Median: The middle value when the data is arranged in order.
- Mode: The most frequently occurring value.
Conclusion
A negatively skewed distribution occurs when most data is on the higher side, creating a long curve to the left. In such distributions, the mean is less than the median. This distribution often occurs in situations like income inequality or exam results where a few outliers pull the mean down. Understanding skewness is essential for accurate data interpretation and analysis.