What is Linear Graph? Definition, Equation, Examples
Last Updated : 23 Jul, 2025
Linear Graph: A Linear Graph is a graphical representation that discusses the relationship between two or more quantities or variables. In the case of any two variables, the relation between these two variables can be drawn by constructing the table of values if the rule for that relation is mentioned.
At least two point coordinates should be known to plot a straight-line graph. These points must fit the rule and such graphs when drawn are termed Linear graphs. In this article, we will discuss linear graph definition, how to plot Linear Equation on a Graph, difference between Linear Graphand Line Graph, along with some Sample Problems on Linear Graph to help you get a better idea of the concepts.
A line graph with continuous or unbroken nature is called a linear graph.
To draw the unbroken line we need to locate some points on the graph sheet. Let's make a graph with an x and y-coordinate.
Suppose you go to an auditorium and search for your reserved seat. You need to know two numbers, the row number, and the seat number. This is the basic method for fixing a point in a plane.
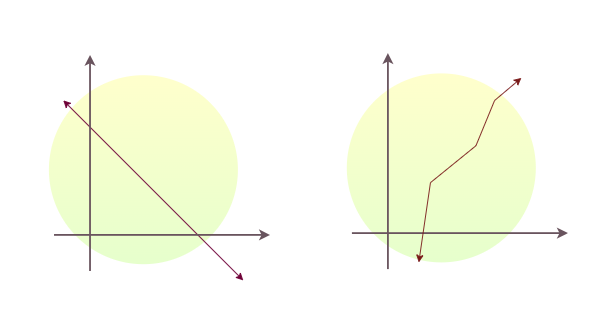
A linear Graph is an unbroken line with the same slope throughout the line and always can be represented by a linear equation.
Whereas, a line graph is a collection of line segments with each starting from where the last one is ending, and all line segments have various slopes. Also, these different line segments can't be represented by a single linear equation.
Difference between Linear Graph and Line Graph
Application of Linear Graphs
In everyday life, we observe variations in the value of different quantities, or we can say that the more we use the facility the more we have to pay for it. For example, if we consume more electricity, we will have to pay the bill more and vice versa. So one quantity affects the other quantity. We can say that the quantity of electricity is the independent variable and the amount of bills is the dependent variable. These relations can be shown with graphs.
Here we have provided you with some sample problems to help you better understand the concepts.
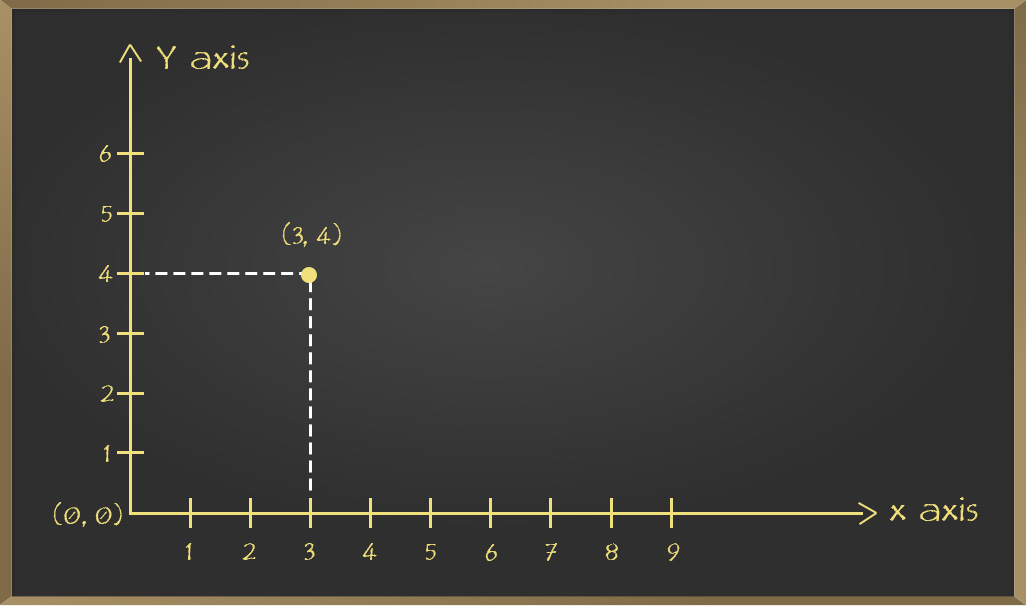
Problem 1: Plot (3, 4) on the graph
Solution:
As in graph points are denoted in the form of (x, y)
So, on comparing the points:
x = 3 and y = 4.
First, draw x = 3 moves in the forward direction to x = 3.
Now, draw y = 4 moves in the upward direction to (3, 4).
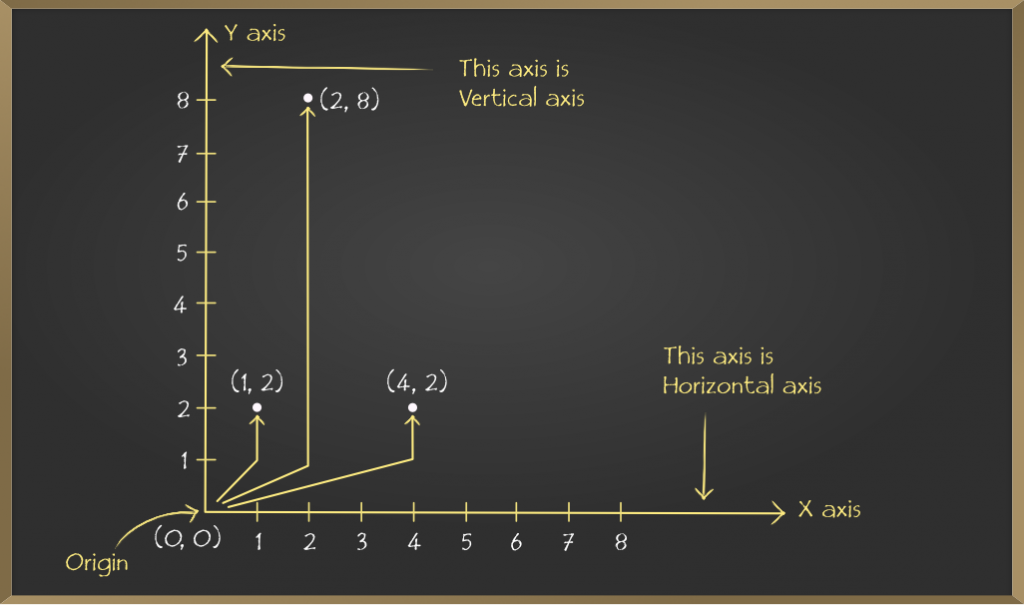
Problem 2: Locate the given points on the graph.
(1, 2)
(2, 8)
(4, 2)
Solution:
For x = 1 and y = 2. Starting from (0, 0) origin we move x = 1 direction forward and from there we move y = 2 direction upward then finally reaching state is our point.
Similarly, plot the rest of the two points on Graph.
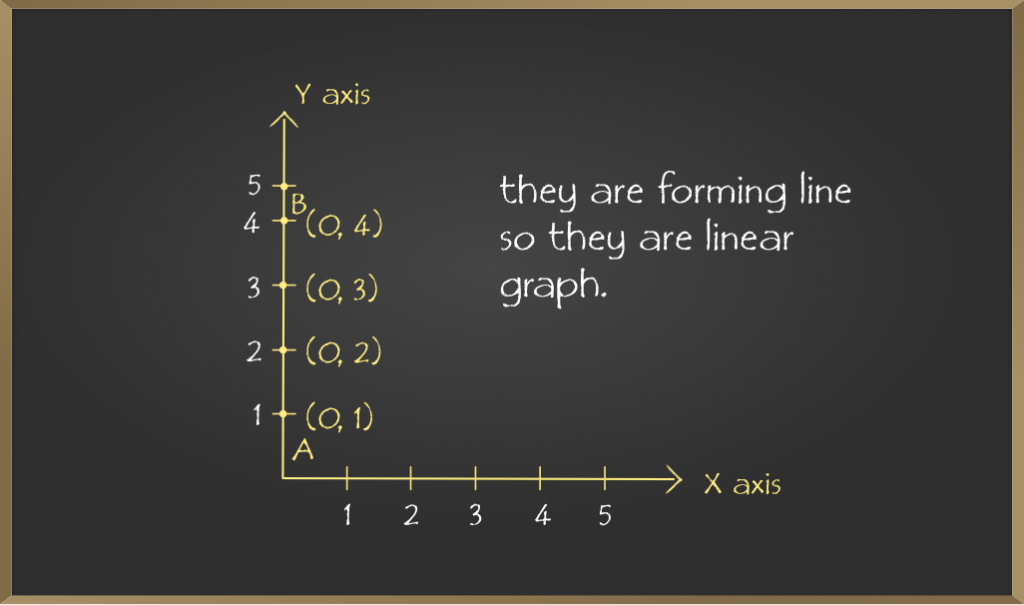
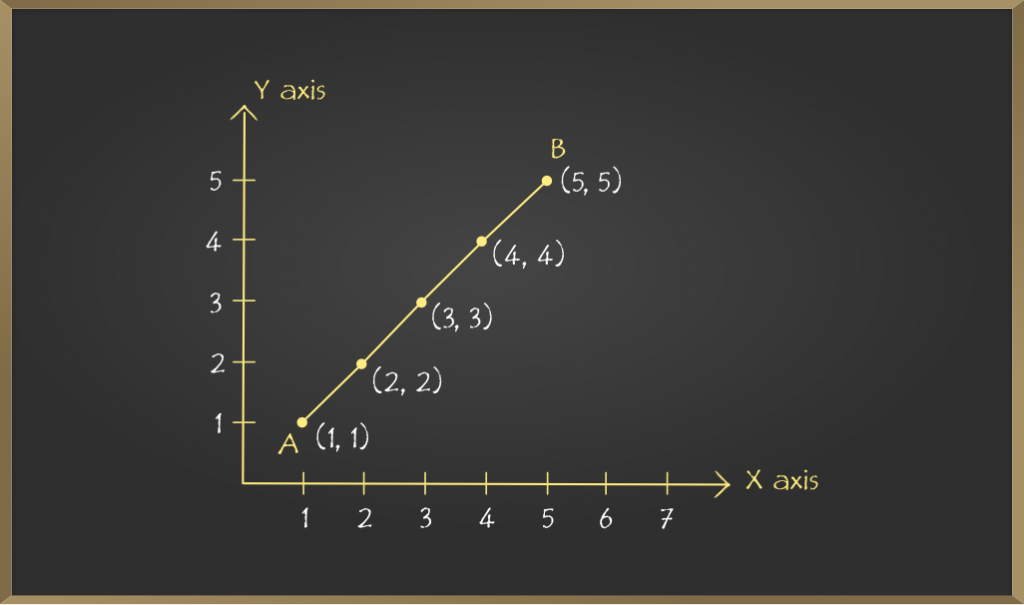
Problem 3: Plot the following points and verify if they lie on the line.
Note: In each of the above cases, the graph obtained by joining the plotted points is a line. Such graphs are called linear graphs.
Problem 4: Amit can ride a bike at a constant speed of 30 km/hour. Draw a time-distance graph for this situation and find it
(i) Time is taken by Amit to ride 75 km.
(ii) Distance covered by Amit in 3.5 hours.
Solution:
Hours of ride
Distance covered
1 hour
2 hours
3 hours
4 hours
30 km
2×30 = 60km
3×30 = 90km
4×30 =120km
The table so formed is:
Time (in hours)
1
2
3
4
Distance covered (in km)
30
60
90
120
Consider the Scale:
Horizontal: 2 units = 1 hour
Vertical: 1 unit = 10 km
Mark time on horizontal axis.
Mark distance on vertical axis
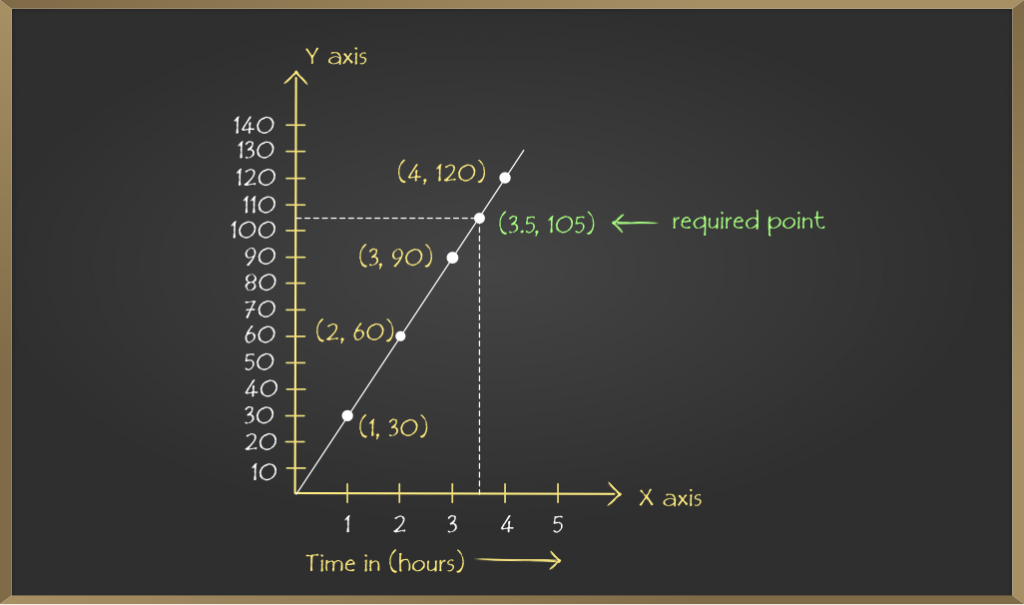
Plot points: (1, 30), (2, 60), (3, 90), (4, 120)
On joining the points the required linear graph is obtained.
(i) From the above graph it is concluded that on the vertical axis corresponding to the distance 75 km, the time is 2.5 hours on the horizontal axis. Thus, 2.5 hours are needed to cover 75 km.
(ii) Similarly, on the horizontal axis corresponding to time 3.5 hours, the distance covered is 105 km on the vertical axis.
Problem 5: A public bank provides 10% interest on deposits by senior citizens. Plot a graph representing the relation between the deposited amount and the interest earned by senior citizens and state the following things from the graph so plotted:
(i) The interest earned annually for an investment of ₹ 450.
(ii) The amount of money deposited to earn the interest of ₹ 35.
Amount deposited (in ₹)
100
300
500
700
900
Interest earned (in ₹)
10
30
50
70
90
Solution:
Consider the Scale:
Horizontal: 1 unit = ₹ 10
Vertical: 1 unit = ₹ 100
Mark interest earned on horizontal axis.
Mark amount deposited on vertical axis.
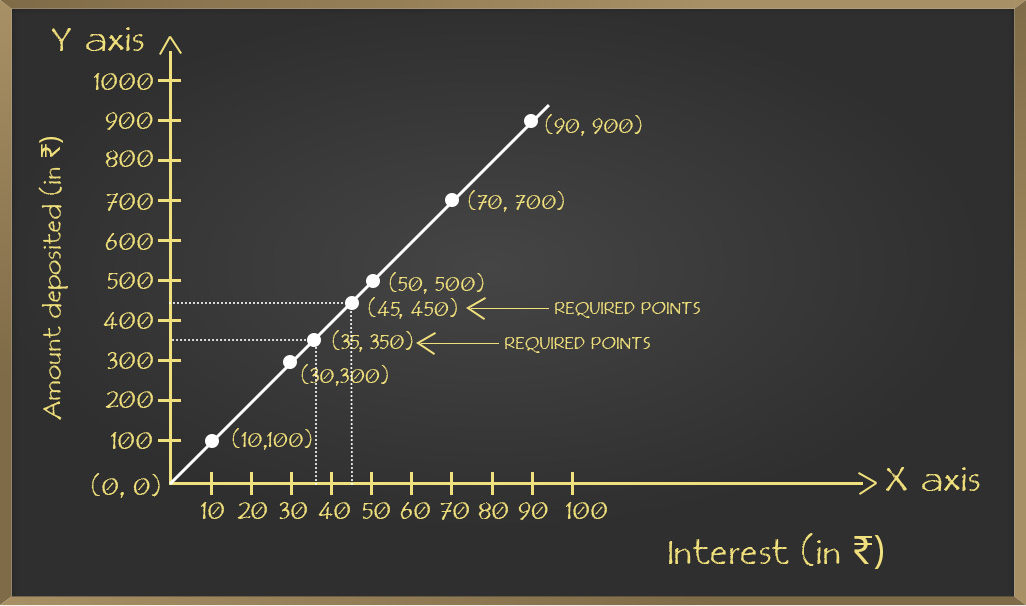
Plot the points: (10, 100), (30, 300), (50, 500), (70, 700) and (90, 900) on the graph.
On joining the points the required linear graph is obtained.
(i) From the above graph it is concluded that on the vertical axis corresponding to the amount deposited ₹ 450, the interest earned is ₹ 45 on the horizontal axis. Thus, ₹ 45 are earned on the deposit of ₹ 450.
(ii) Similarly, on the horizontal axis corresponding to interest earned 35%, the amount deposited is ₹ 350 on the vertical axis.