An exponential graph is the graphical representation of an exponential function of the form: f(x) = kax
The exponential graph may look in one of the following ways:
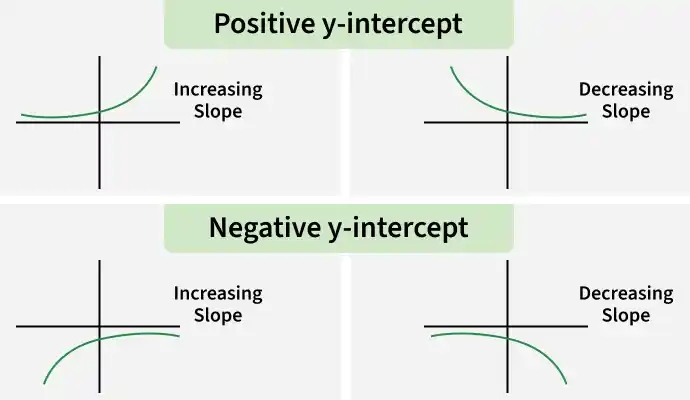
It is a non-linear curve characterized by
- A horizontal asymptote (usually the x-axis or a shifted line).
- A constant base with the variable in the exponent.
- A rapid rate of change (growth or decay).
Graphing Exponential Function
Graphing an exponential function means drawing the curve of a function of the form: f(x) = aˣ (or f(x) = aˣ + b), where a > 0 and a ≠ 1.
The graph always has a horizontal asymptote. For f(x) = aˣ, the asymptote is y = 0, and for f(x) = aˣ + b, the asymptote is y = b.
Steps to graph an exponential function
Step 1: Identify the horizontal asymptote (y = 0 or y = b).
Step 2: Find the y-intercept by putting x = 0.
Step 3: Choose a few values of x (such as -1, 0, 1) and calculate corresponding values of y.
Step 4: Plot the points on the graph.
Step 5: Join the points smoothly to form a curve that approaches the asymptote but never touches it.
Example: Graph the exponential function
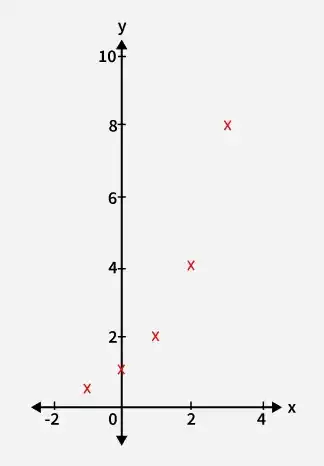
Solution: To draw the graph, we find the values of y for different values of x in the given range.
| x | y |
|---|---|
| -1 | 2⁻¹ = 0.5 |
| 0 | 2⁰ = 1 |
| 1 | 2¹ = 2 |
| 2 | 2² = 4 |
| 3 | 2³ = 8 |
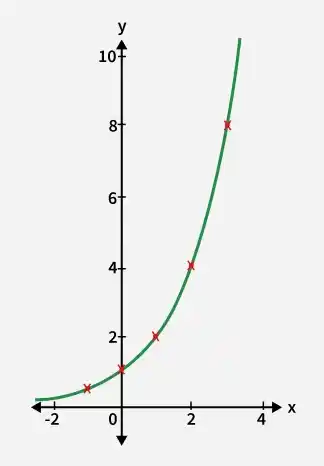
- Plot these points on the coordinate plane.
- Now join the plotted points smoothly to obtain the exponential curve.
Exponential Growth and Decay Graph
An exponential function is of the form f(x) = aˣ, where a > 0 and a ≠ 1.
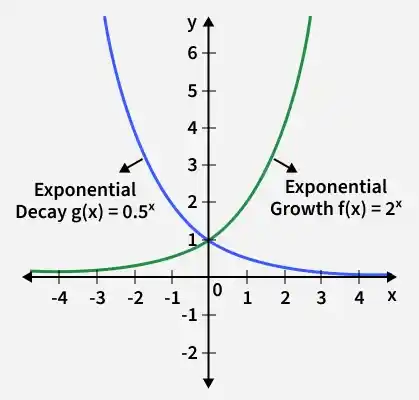
- If a > 1, the function represents exponential growth (the graph increases from left to right).
- If 0 < a < 1, the function represents exponential decay (the graph decreases from left to right).
Examples:
f(x) = 2ˣ → exponential growth
g(x) = (1/2)ˣ → exponential decay
The exponential growth and decay graphs are shown below:
Solved Examples
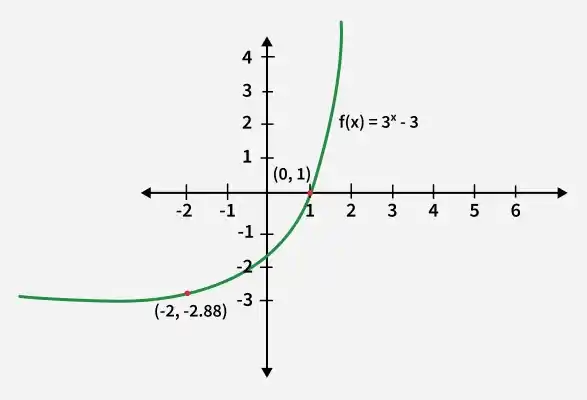
Example 1: Consider an example of f(x) = 3x - 3. Draw the graph.
Solution:
1: Find Asymptote:
We can see that in the above given f(x), the bias is added so the asymptote will not simply be the x-axis, but will be shifted by a value of b(-3 in this case).
2: Calculate y-intercept:
To find the y-intercept, we have to put x=0,
f(0) = 30 - 3 = 1 - 3 = -2
Step 3: Take 3-4 points randomly to draw the graph:
x | f(x) = 3x - 3 |
|---|---|
-3 | ⇒ 3-3 - 3 = -2.96 |
-2 | ⇒ 3-2 - 3 = -2.88 |
2 | ⇒ 32 - 3 = 6 |
3 | ⇒ 33 - 3 = 24 |
4 | ⇒ 34 - 3 = 78 |
Plot these points to see the graph
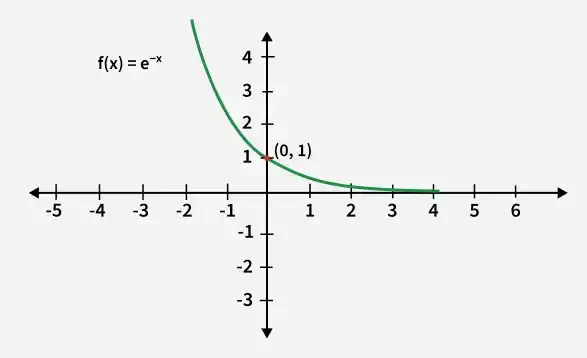
Example 2: Draw a Graph of e-x
Solution: The graph of e-x is added below:
Practice Questions
Problem 1: Draw a graph for ex and find out whether it is a decay or a growth graph.
Problem 2: Mention the asymptote and draw the graph for f(x) = 80 - 9x.
Problem 3: Find the y-intercept and draw the graph for f(x) = (0.1)x and find out whether it is a decay or a growth graph.