In statistics, mean, median, and mode are measures of central tendency that describe the center or typical value of a data set.
Given below is the graphical difference between each:
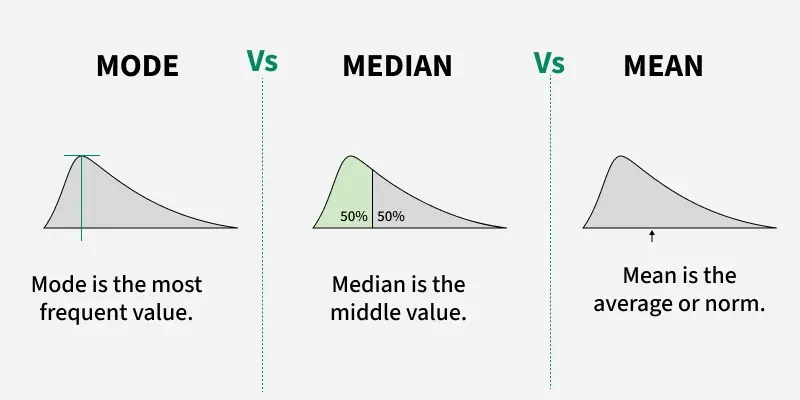
Key features of central tendencies:
- The mean is the average, found by adding all values and dividing by the number of values. It gives an overall measure but can be affected by extreme values.
- The median represents the middle value of a data set when the numbers are arranged in order, and it isn’t easily influenced by unusually high or low numbers.
- The mode is the most frequent value in the dataset. These measures help summarize data and provide insights into its central characteristics.
Mean vs Median vs Mode
All these measures of central tendency are correlated. They share an empirical relationship but are different from each other. Here are the differences:
Mean: The mean is the average of a given set of observations.
- It represents the arithmetic mean, commonly referred to as the simple average or sometimes a weighted average (when different values have different weights).
When data follows a normal distribution, the mean is generally the most appropriate measure of central tendency to use.
Steps to find:
- Step 1: Add all the numbers in the data set.
- Step 2: Divide the total by the number of values in the data set.
Formula:
- If the total number of observations (n) is odd, then the median is: Median = ((n + 1)/2)th observation
- If the total number of observations (n) is are even number, then the formula is given below: Median = (n/2)th observation + (n/2+1)th observation /2
Examle: For the dataset 2,3,5,7,11, the mean would be:
\frac{2 + 3 + 5 + 7 + 11}{5} = \frac{28}{5} = 5.6
Median: The median is the middle value in a set of observations arranged in ascending or descending order.
- If the number of observations is even, the median is the average of the two middle values.
- When the data distribution is skewed, the median serves as the most reliable measure of central tendency, as it is less affected by extreme values.
Steps to find:
- Step 1: Arrange the numbers in order from smallest to biggest.
- Step 2: Find the middle number. If there are two middle numbers, take their average.
Formula:
- If the total number of observations (n) is odd, then the median is: Median = (n + 1/2)th observation
- If the total number of observations (n) is are even number, then the formula is given below: Median = (n/2)th observation + (n/2+1)th observation /2
Example: For the dataset 2, 3, 5, 7, 11, the median would be: The median is 5 (the middle number).
Mode: The mode is the most frequently occurring value in a given set of observations.
- If all values occur with the same frequency, the data set has no mode.
- When the data is nominally distributed (categorical data), the mode is the most appropriate measure of central tendency.
Steps to find:
- Step 1: Identify the number(s) that appear most frequently in the data set.
- Step 2: The number with the highest frequency is the mode.
Formula:
L + (\frac{f_1 - f_m}{2f_1 - f_m - f_2 }) \times h
Example: In the dataset 1,2,2,3,3,3. The mode is 3 because it appears the most (three times).
Sample Questions on Central Tendency
Question 1: We have a set of numbers that is 4, 8, 2, 1, 1, 4, 3, 1. Find the mean, median, and mode.
Solution:
Mean:
8 + 4 + 2 + 1 + 1 + 4 + 3 + 1 = 24 and 24/8 = 3
Median:
(2 + 3)/2 = 2.5 (after arranging the numbers in ascending order as 1, 1, 1, 2, 3, 4, 4, 8 and middle terms are 2 and 3 as total number of terms are 8 which is even)
Mode:
1 because it is present 3 times in the sequence
Question 2: We have a set of numbers that is 4, 2, 1, 6, 5, 3, 7, 1, 10, 9, 8. Find the mean, median, and mode.
Solution:
Mean:
1 + 1 + 2 +3 + 4 + 5 + 6 + 7 + 8 + 9 + 10 = 56 and 56/10 = 5.6
Median:
5 (after arranging in ascending order 1, 1, 2, 3, 4, 5, 6, 7, 8, 9, 10 the middle term is 5)
Mode:
1 {as it is repeated the highest number of times(2 times)}.
Unsolved Practice Questions on Mean, Median, and Mode
Question 1: The heights (in cm) of five students are recorded as 150, 155, 160, 165, and 170. Find the mean height of the students.
Question 2: Find the median of the following data set: 22, 18, 26, 30, 24, 20, 28.
Question 3: A survey recorded the number of pets owned by a group of 8 families: 2, 3, 4, 2, 5, 3, 2, 4. What is the mode of the data set?
Question 4: The ages (in years) of participants in a workshop are: 21, 25, 28, 22, 30, 21, 25, 24, 22, and 26. Find the mean, median, and mode of the ages.
Question 5: In a dataset, the mean is 70 and the median is 65. Using the relationship between mean, median, and mode, estimate the mode.
Answer key:
- 160 cm
- 24
- 2 (appears most frequently)
- 27.4, 24.5, [21, 22, 25 (all appear twice → multiple modes)]
- 55