Data is a simple record or collection of different numbers, characters, images, and others that are processed to form information.
In statistics, we have different types of data that are used to represent various information. We analyse the data to obtain any meaningful information, and thus categorising it into different types is very important.
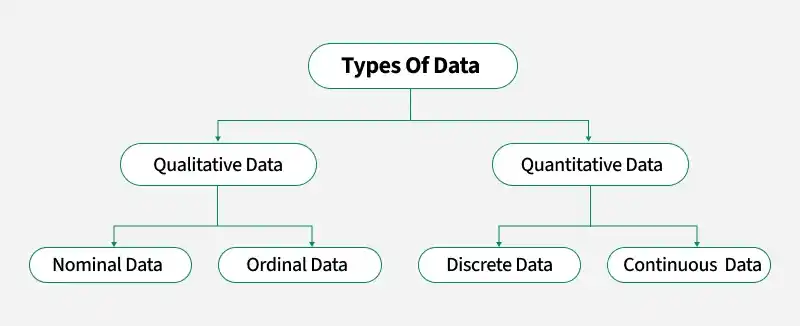
Qualitative Data (Categorical Data)
Qualitative data is also called categorical data, and it categorises the data into various categories. Qualitative data includes data such as the gender of people, their family names, and others in a sample of population data.
Qualitative data is further categorised into two categories that include,
- Nominal Data
- Ordinal Data
Nominal Data
Nominal data is a type of data that consists of categories or names that cannot be ordered or ranked. It is often used to categorize observations into groups, and the groups are not comparable. In other words, nominal data has no inherent order or ranking.
Examples of nominal data include:
- Gender (Male or female),
- Race (White, Black, Asian),
- Religion (Hinuduism, Christianity, Islam, Judaism),
- Blood type (A, B, AB, O), etc.
Nominal data can be represented using frequency tables and bar charts, which display the number or proportion of observations in each category.
For example, a frequency table for gender might show the number of males and females in a sample of people.
Nominal data is analyzed using non-parametric tests, which do not make any assumptions about the underlying distribution of the data. Common non-parametric tests for nominal data include chi-squared tests and Fisher's exact tests. These tests are used to compare the frequency or proportion of observations in different categories.
Ordinal Data
Ordinal data is a type of data that consists of categories that can be ordered or ranked. However, the distance between categories is not necessarily equal. Ordinal data is often used to measure subjective attributes or opinions, where there is a natural order to the responses.
Examples of ordinal data include:
- Education level (Elementary, Middle, High School, College),
- Job position (Manager, Supervisor, Employee), etc.
Ordinal data can be represented using bar charts or line charts. These displays show the order or ranking of the categories, but they do not imply that the distances between categories are equal.
Ordinal data is analyzed using nonparametric tests, which make no assumptions about the underlying distribution of the data. Common non-parametric tests for ordinal data include the Wilcoxon Signed-Rank test and the Mann-Whitney U test.
Quantitative Data (Numerical Data)
Quantitative data is the type of data that represents the numerical value of the data. They are also called numerical data. This data type is used to represent the height, weight, length, and other things of the data. Quantitative data is further classified into two categories that are,
- Discrete Data
- Continuous Data
Discrete Data
The discrete data type is a type of data in statistics that only uses discrete values or single values. These data types have values that can be easily counted as whole numbers.
Example of the discreate data types are,
- Height of Students in a class
- Marks of the students in a class test
- Weight of different members of a family, etc.
Continuous Data
Continuous data is the type of quantitative data that represents the data in a continuous range. The variable in the data set can have any value within the range of the data set.
Examples of the continuous data types are,
- Temperature Range
- Salary range of Workers in a Factory, etc.