The correlation coefficient is a numerical measure that shows the strength and direction of the relationship between two variables. Its value lies between -1 and +1.
Types of Correlation
There are mainly 3 types of correlation.
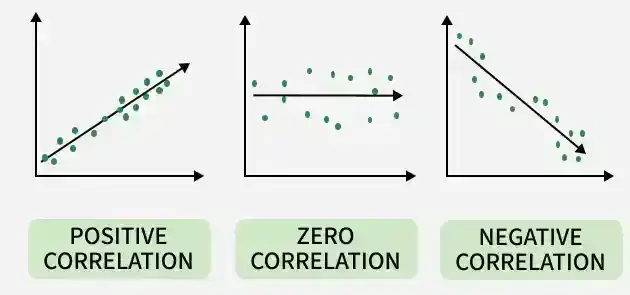
- Positive Correlation: Both variables increase or decrease together.
- Zero Correlation: No relationship between the variables.
- Negative Correlation: One variable increases while the other decreases.
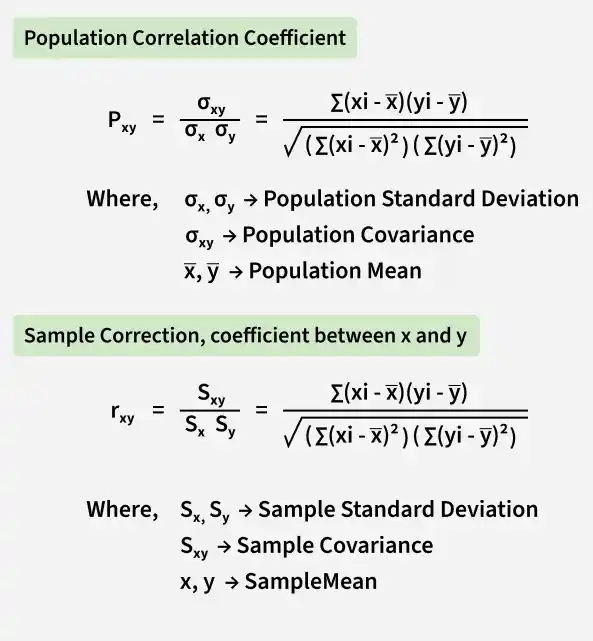
Types of Correlation Coefficient Formula
Different formulas are used to calculate the correlation coefficient depending on the data (sample or population).
The main types are shown below:
Solved Problems
Problem 1: Calculate the correlation coefficient from the following table:
| SUBJECT | AGE (X) | GLUCOSE LEVEL (Y) |
|---|---|---|
| 1 | 42 | 98 |
| 2 | 23 | 68 |
| 3 | 22 | 73 |
| 4 | 47 | 79 |
| 5 | 50 | 88 |
| 6 | 60 | 82 |
Solution:
Make a table from the given data and add three more columns of XY, X², and Y².
SUBJECT AGE (X) GLUCOSE LEVEL (Y) XY X² Y² 1 42 98 4116 1764 9604 2 23 68 1564 529 4624 3 22 73 1606 484 5329 4 47 79 3713 2209 6241 5 50 88 4400 2500 7744 6 60 82 4980 3600 6724 ∑ 244 488 20379 11086 40266 ∑xy = 20379
∑x = 244
∑y = 488
∑x² = 11086
∑y² = 40266
n = 6.
Put all the values in the Pearson's correlation coefficient formula:
R= \frac{n(∑xy) - (∑x)(∑y)}{\sqrt{[n∑x²-(∑x)²][n∑y²-(∑y)²}} R = 6(20379) - (244)(488) / √[6(11086)-(244)²][6(40266)-(488)² ]
R = 3202 / √[6980][3452]
R = 3202/4972.238
R = 0.6439
It shows that the relationship between the variables of the data is a strong positive relationship.
Problem 2: Calculate the correlation coefficient from the following table:
| SUBJECT | AGE (X) | Weight (Y) |
|---|---|---|
| 1 | 40 | 99 |
| 2 | 25 | 79 |
| 3 | 22 | 69 |
| 4 | 54 | 89 |
Solution:
Make a table from the given data and add three more columns of XY, X², and Y².
SUBJECT AGE (X) Weight (Y) XY X² Y² 1 40 99 3960 1600 9801 2 25 79 1975 625 6241 3 22 69 1518 484 4761 4 54 89 4806 2916 7921 ∑ 151 336 12259 5625 28724 ∑xy = 12258
∑x = 151
∑y = 336
∑x² = 5625
∑y² 28724
n = 4
Put all the values in the Pearson's correlation coefficient formula:
R= \frac{n(∑xy) - (∑x)(∑y)}{\sqrt{[n∑x²-(∑x)²][n∑y²-(∑y)²}} R = 4(12258) - (151)(336) / √[4(5625)-(151)²][4(28724)-(336)²]
R = -1704 / √[-301][-2000]
R=-1704/775.886
R=-2.1961
It shows that the relationship between the variables of the data is a very strong negative relationship.
Problem 3: Calculate the correlation coefficient for the following data:
X = 7,9,14 and Y = 17,19,21
Solution:
Given variables are,
X = 7,9,14
and,
Y = 17,19,21
To, find the correlation coefficient of the following variables Firstly a table is to be constructed as follows, to get the values required in the formula.
X Y XY X² Y² 7 17 119 49 36 9 19 171 81 361 14 21 294 196 441 ∑ 30 ∑ 57 ∑ 584 ∑ 326 ∑ 838 ∑xy = 584
∑x = 30
∑y = 57
∑x² = 326
∑y² = 838
n = 3
Put all the values in the Pearson's correlation coefficient formula:
R= \frac{n(∑xy) - (∑x)(∑y)}{\sqrt{[n∑x²-(∑x)²][n∑y²-(∑y)²}} R = 3(584) - (30)(57) / √[3(326)-(30)²][3(838)-(57)²]
R = 42 / √[78][-735]
R = 42/-239.43
R = -0.1754
It shows that the relationship between the variables of the data is negligible relationship
Problem 4: Calculate the correlation coefficient for the following data:
X = 21, 31, 25, 40, 47, 38 and Y = 70,55,60,78,66,80
Solution:
Given variables are,
X = 21,31,25,40,47,38
And,
Y = 70,55,60,78,66,80
To, find the correlation coefficient of the following variables Firstly a table is to be constructed as follows, to get the values required in the formula.
X Y XY X² Y² 21 70 1470 441 4900 31 55 1705 961 3025 25 60 1500 625 3600 40 78 3120 1600 6094 47 66 3102 2209 4356 38 80 3040 1444 6400 ∑202 ∑409 ∑13937 ∑7280 ∑28265 ∑xy = 13937
∑x = 202
∑y = 409
∑x² = 7280
∑y² = 28265
n = 6
Put all the values in the Pearson's correlation coefficient formula:
R= \frac{n(∑xy) - (∑x)(∑y)}{\sqrt{[n∑x²-(∑x)²][n∑y²-(∑y)²}} R = 6(13937) - (202)(409) / √[6(7280) - (202)²][6(28265) - (409)²]
R = 1004 /√[2876][2909]
R = 1004 / 2892.452938
R = 0.3471
It shows that the relationship between the variables of the data is a moderate positive relationship.
Problem 5: Calculate the correlation coefficient for the following data?
X = 5 ,9 ,14, 16 and Y = 6, 10, 16, 20 .
Solution:
Given variables are,
X = 5 ,9 ,14, 16
And
Y = 6, 10, 16, 20.
To, find the correlation coefficient of the following variables Firstly a table is to be constructed as follows, to get the values required in the formula add all the values in the columns to get the values used in the formula
X Y XY X² Y² 5 6 30 25 36 9 10 90 81 100 14 16 224 196 256 16 20 320 256 400 ∑44 ∑52 ∑664 ∑558 ∑792 ∑xy = 664
∑x = 44
∑y = 52
∑x² = 558
∑y² = 792
n = 4
Put all the values in the Pearson's correlation coefficient formula:
R= n(∑xy) - (∑x)(∑y) / √[n∑x²-(∑x)²][n∑y²-(∑y)² R = 4(664) - (44)(52) / √[4(558) - (44)²][4(792) - (52)²]
R = 368 / √[296][464]
R = 368/370.599
R = 0.9930
It shows that the relationship between the variables of the data is a very strong positive relationship.