Duplicate data is a common issue in real-world datasets, where identical rows or repeated values appear more than once. If not handled properly, duplicates can affect analysis results and lead to incorrect conclusions. R provides simple functions to identify and remove duplicates from vectors and data frames.

- Duplicates can occur in rows, columns or specific variables.
- They often result from data entry errors or dataset merging.
- Functions like duplicated() and unique() help manage them efficiently.
Identifying Duplicate Data in vector
We can use duplicated() function to find out how many duplicates value are present in a vector. The sum() function will give us the count of the number of duplicate values.
vec <- c(1, 2, 3, 4, 4, 5)

duplicated(vec)

sum(duplicated(vec))
Output:
FALSE FALSE FALSE FALSE TRUE FALSE
1
Here, the value 4 appears twice, so one duplicate is identified.
Removing Duplicate Data in a vector
We can remove duplicate data from vectors by using unique() functions so it will give only unique values.
vec <- c(1, 2, 3, 4, 4, 5)

unique(vec)
Output:
[1] 1 2 3 4 5
Identifying Duplicate Data in a Data Frame
We will use the duplicated() function which returns the count of duplicate rows present in a data frame.
Syntax:
duplicated(dataframe)
res=data.frame(name=c("Ram","Geeta","John","Paul",
                                 "Cassie","Geeta","Paul"),
                          maths=c(7,8,8,9,10,8,9),
                          science=c(5,7,6,8,9,7,8),
                          history=c(7,7,7,7,7,7,7))

res
duplicated(res)
sum(duplicated(res))
Output:
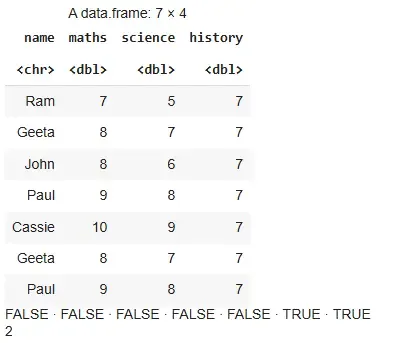
Here:
- duplicated(res) returns a logical vector indicating duplicate rows.
- sum() gives the total number of duplicate rows.
Removing Duplicate Data in a data frame
We will see some different methods to handle duplicate values in a data frame.
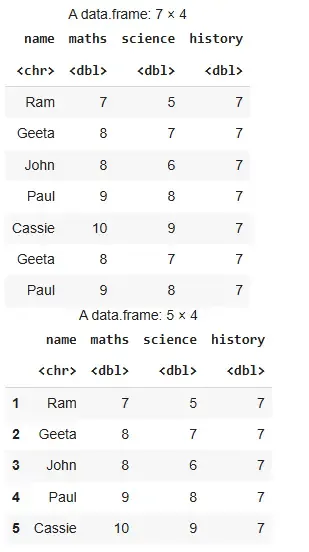
Method 1: Using unique()
We use unique() to get rows having unique values in our data.
Syntax:
unique(dataframe)
res=data.frame(name=c("Ram","Geeta","John","Paul",
                                 "Cassie","Geeta","Paul"),
                          maths=c(7,8,8,9,10,8,9),
                          science=c(5,7,6,8,9,7,8),
                          history=c(7,7,7,7,7,7,7))

res
unique(res)
Output:
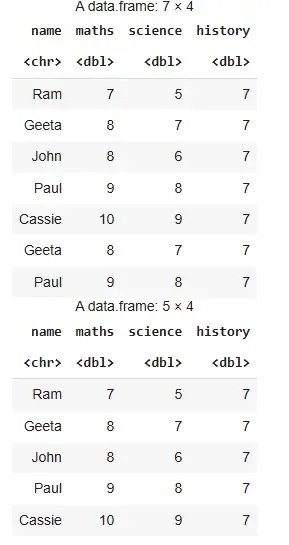
Method 2: Using distinct()
To use this method, tidyverse package should be installed and dplyr library should be loaded. We use distinct() to get rows having distinct values in our data.
Syntax
distinct(dataframe,keep_all=TRUE)
Parameter:
- dataframe: data in use
- keepall: decides which variables to keep
Example 1: Using distinct function
library(tidyverse)

res=data.frame(name=c("Ram","Geeta","John","Paul",
                                 "Cassie","Geeta","Paul"),
                          maths=c(7,8,8,9,10,8,9),
                          science=c(5,7,6,8,9,7,8),
                          history=c(7,7,7,7,7,7,7))

res
distinct(res)
Output:
Example 2: Printing unique rows in terms of maths column
res=data.frame(name=c("Ram","Geeta","John","Paul",
                                 "Cassie","Geeta","Paul"),
                          maths=c(7,8,8,9,10,8,9),
                          science=c(5,7,6,8,9,7,8),
                          history=c(7,7,7,7,7,7,7))

res
distinct(res,maths,.keep_all = TRUE)
Output:
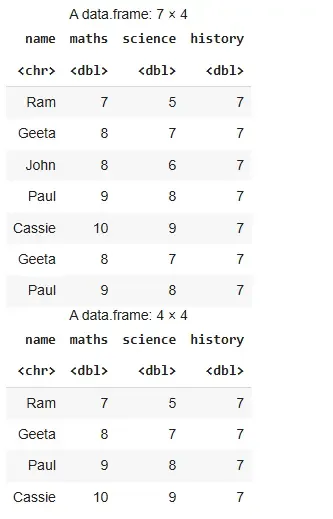
The output returns a data frame with distinct rows based on the "maths" column, keeping only the first occurrence of each unique value.