Feature scaling is a data preprocessing technique used to adjust the range of numerical variables in a dataset. It ensures that different features are measured on a similar scale, which improves the performance and accuracy of many statistical and machine learning models in R.
- Ensures that large-scale values do not dominate smaller-scale values.
- Makes distance-based calculations more accurate in algorithms such as KNN, SVM and regression models.
- Speeds up model training and improves convergence.
Types of Feature Scaling in R
Feature scaling adjusts numerical variables so they are measured on a similar scale. Below are the main types of feature scaling used in R:
1. Min-Max Scaling (Normalization)
Min-Max scaling is a method that rescales numerical data into a fixed range, usually between 0 and 1. It adjusts all values proportionally so the smallest value becomes 0 and the largest becomes 1. This method is used when a specific bounded range is required, especially in distance-based algorithms such as KNN.
X_{scaled}=\frac{X-X_{min}}{X_{max}-X_{min}}
where
X : Original valueX_{min} : Minimum value in the datasetX_{max} : Maximum value in the dataset
2. Standardization (Z-Score Scaling)
Standardization is a scaling method that adjusts data using the mean and standard deviation. It transforms the dataset so that it has a mean of 0 and a standard deviation of 1. This method is commonly used for normally distributed data and regression models.
Z=\frac{X-\mu}{\sigma}
where
\mu : Mean of the dataset\sigma : Standard deviationZ : Standardized value
3. Robust Scaling
Robust Scaling is a technique that scales data using the median and interquartile range (IQR). It centers the dataset around the median and reduces the effect of extreme values or outliers. This method is suitable when the dataset contains outliers that may affect other scaling techniques.
X_{scaled}=\frac{X-Median}{IQR}
where
- Median: Middle value of the dataset
- IQR: Interquartile Range (Q3 − Q1)
4. Max Absolute Scaling
Max Absolute Scaling is a method that divides each value by the maximum absolute value in the dataset. It scales the values between -1 and 1 without changing the shape of the data distribution. This method is used when the data is already centered around zero and contains both positive and negative values.
X_{scaled}=\frac{X}{|X_{max}|}
where
5. Unit Vector Scaling
Unit Vector Scaling adjusts values so that the total length (magnitude) of each data point becomes 1. It is often used in similarity calculations and text analysis.
X_{scaled}=\frac{X}{\sqrt{\sum X^{2}}}
where
Implementing Feature Scaling in R
Here, we apply feature scaling techniques to a sample dataset in R.
Create a Sample Dataset
First, create a simple dataframe containing numerical variables on different scales.
age <- c(19,20,21,22,23,24,24,26,27)

salary <- c(10000,20000,30000,40000,
            50000,60000,70000,80000,90000)

df <- data.frame(
  Age = age,
  Salary = salary,
  stringsAsFactors = FALSE
)

df
Output
  Age Salary
1  19  10000
2  20  20000
3  21  30000
4  22  40000
5  23  50000
6  24  60000
7  24  70000
8  26  80000
9  27  90000
The dataset contains two numeric columns with different ranges. Feature scaling will bring them to a comparable scale.
Manual Implementation Using Formulas
Feature scaling can be applied manually in R by directly using mathematical expressions on each column of the dataset.
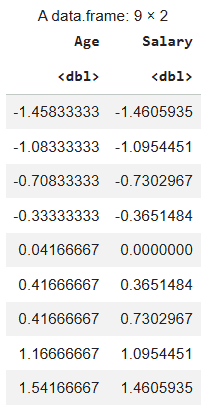
Standardization: Here we manually standardize the dataset df so that each column has a mean of 0 and a standard deviation of 1 and the result is stored in a new dataframe.
scaled_standard <- as.data.frame(
  lapply(df, function(x) (x - mean(x)) / sd(x))
)

scaled_standard
Output:
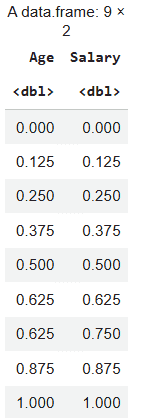
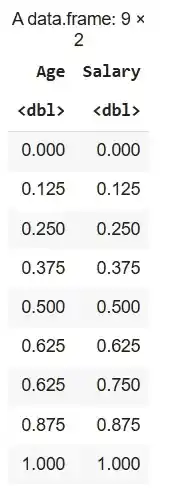
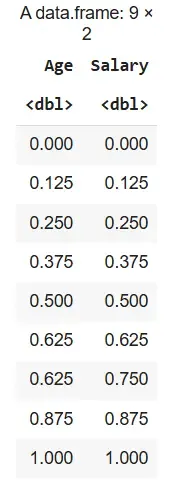
Min-Max Normalization: Here we are manually normalizing the dataset df to a 0-1 range and the transformed values are saved in a new dataframe.
scaled_minmax <- as.data.frame(
  lapply(df, function(x) (x - min(x)) / (max(x) - min(x)))
)

scaled_minmax
Output:
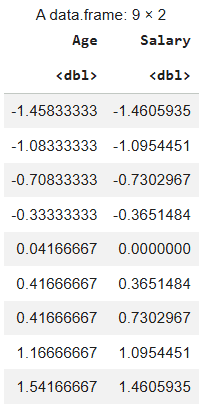
Using Built-in scale() Function
R provides a built-in function called scale() to perform feature scaling easily. By default, scale() performs standardization not normalization.
scaled_base <- as.data.frame(scale(df))
scaled_base
Output:
Using the caret Package
Import the caret library and then apply standardization and normalization.
install.packages("caret")
library(caret)
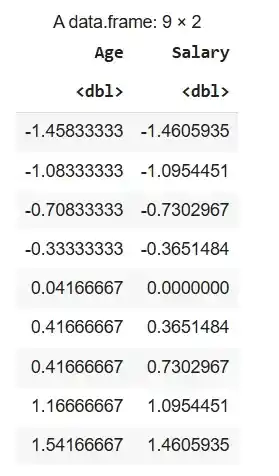
1. Standardization Using Caret Library: We standardize the dataset df using the caret package by applying centering and scaling to its numeric columns. The preProcess() function prepares the scaling method and predict() applies it to the dataset.
pre_std <- preProcess(df, method = c("center", "scale"))
caret_standard <- predict(pre_std, df)
caret_standard
Output:
2. Normalisation Using Caret Library: Here we normalize the dataset df to a 0–1 range using the caret package. The preProcess(method = "range") function defines the normalization method and predict() applies it to the dataset.
pre_range <- preProcess(df, method = "range")
caret_minmax <- predict(pre_range, df)
caret_minmax
Output:
Using Dplyr Library
Installs the dplyr package and loads it into the R session so its data manipulation functions can be used.
install.packages("dplyr")
library(dplyr)
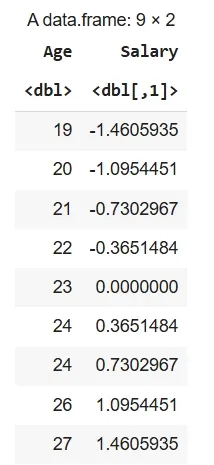
1. Standardization Using Dplyr Library: Here we standardize the "Salary" column in df using the scale() function with mutate_at() and store the result in data_s.
data_s <- df %>%
  mutate(across(c(Salary), scale))

data_s
Output:
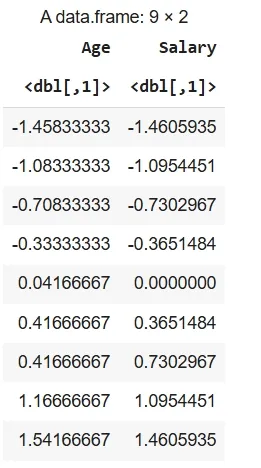
2. Normalization Using Dplyr Library: Here we standardize all columns in df using the scale() function with mutate_all() and store the transformed data in data_n.
library(dplyr)

data_n <- df %>%
  mutate(across(everything(), ~ (. - min(.)) / (max(.) - min(.))))

data_n
Output:
Using BBmisc package
The BBmisc package in R provides utility functions for data preprocessing, including simple functions for standardization and normalization of datasets.
install.packages("BBmisc")
library(BBmisc)
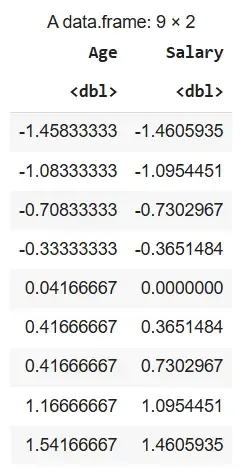
1. Standardization Using BBmisc Package: The entire dataset df is standardized using the normalize() function with method = "standardize" and the transformed values are stored in df_standardized.
df_standardized <- BBmisc::normalize(df, method = "standardize")
df_standardized
Output:
2. Normalization Using BBmisc Package: The dataset df is normalized to a 0–1 range using the normalize() function with method = "range" and the scaled values are stored in df_normalized.
library(BBmisc)
df_normalized <- BBmisc::normalize(df, method = "range")
df_normalized
Output:
Advantages
- Improves Model Performance: Scaling ensures that no feature dominates the model due to larger numeric values, leading to better accuracy.
- Faster Convergence: Scaled features help gradient-based algorithms reach optimal solutions more quickly.
- Fair Distance Calculation: It prevents variables with large ranges from overpowering smaller ones in distance-based methods like KNN and K-means.
- Numerical Stability: Scaling reduces computational errors that may occur due to very large or very small values.
- Better Coefficient Comparison: Standardized features make model coefficients easier to compare and interpret.
- Effective Regularization: It allows techniques like Ridge and Lasso to penalize features evenly.