In R programming, jittering means adding small amount of random noise to a numeric vector object. In this article, we'll learn to use r 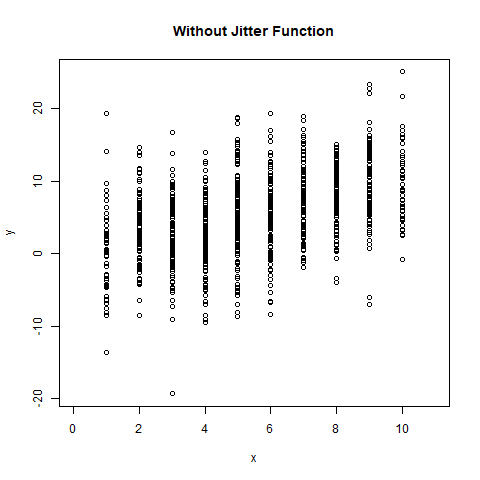
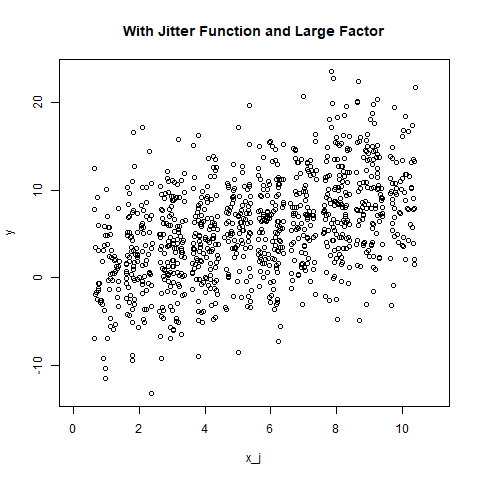
 Example 2: With large factor value
r 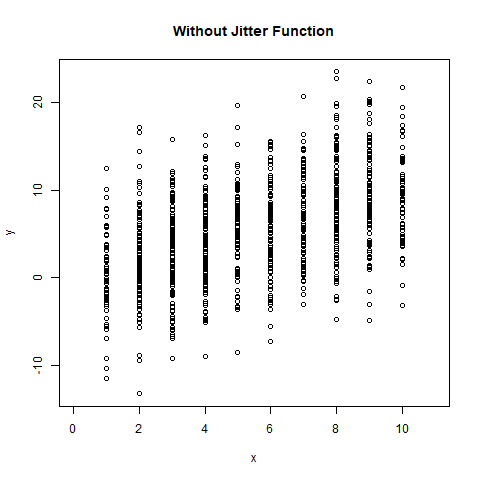
jitter() function and create a plot to visualize them.
Syntax: jitter(x, factor) Parameters: x: represents numeric vector factor: represents numeric value for factor specificationExample 1:
# Define numeric vectors
x <- round(runif(1000, 1, 10))
y <- x + rnorm(1000, mean = 0, sd = 5)
# output to be present as PNG file
png(file="withoutJitter.png")
# Plotting without jitter function
plot(x, y, xlim = c(0, 11),
main = "Without Jitter Function")
# saving the file
dev.off()
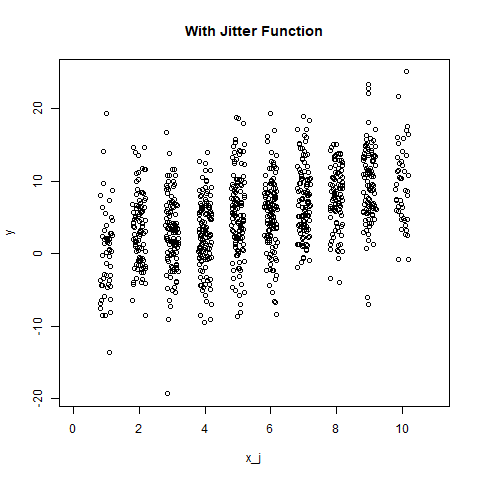
x_j <- jitter(x)
# output to be present as PNG file
png(file="withJitter.png")
# Plotting with jitter function
plot(x_j, y, xlim = c(0, 11),
main = "With Jitter Function")
# saving the file
dev.off()
# Define numeric vectors
x <- round(runif(1000, 1, 10))
y <- x + rnorm(1000, mean = 0, sd = 5)

# output to be present as PNG file
png(file="withoutJitterFactor.png")

# Plotting without jitter function
plot(x, y, xlim = c(0, 11),
     main = "Without Jitter Function")

# saving the file
dev.off()

x_j <- jitter(x, factor = 2)

# output to be present as PNG file
png(file="withJitterFactor.png")

# Plotting with jitter function
plot(x_j, y, xlim = c(0, 11),
     main = "With Jitter Function and Large Factor")

# saving the file
dev.off()