Spreadsheet navigation is a fundamental skill required to work efficiently with data. Before performing calculations or analysis, it is important to understand the spreadsheet environment, interface layout, and navigation techniques.
Why Learning Excel Navigation is Important:
- Improves working speed
- Reduces data entry mistakes
- Helps understand spreadsheet structure
- Builds foundation for formulas and data analysis
Getting Started with Excel
1. Download and Setup
To begin working with Excel:
- Ensure you have a Microsoft account
- Download and install Excel on your system
- Open Excel using the Windows Start Menu
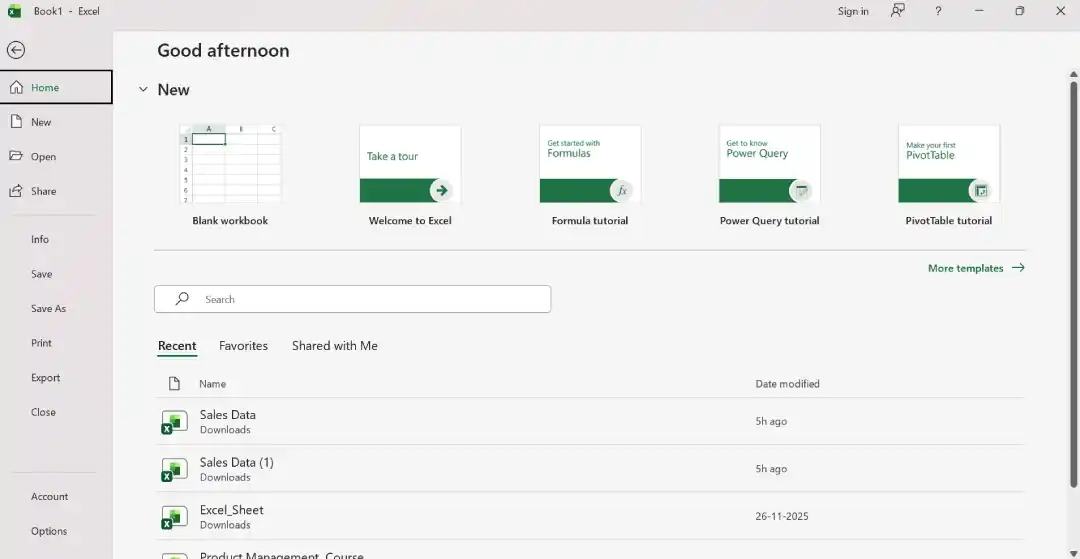
When opening Excel for the first time, you will see multiple templates designed for different tasks. These templates can help you get started quickly.
For learning and practice purposes, select Blank Workbook to create a new spreadsheet.
2. Excel Interface Overview
Once you open a blank workbook, you will see the Excel interface with multiple tabs and tools. Understanding these tabs is essential because they control how you interact with your data.
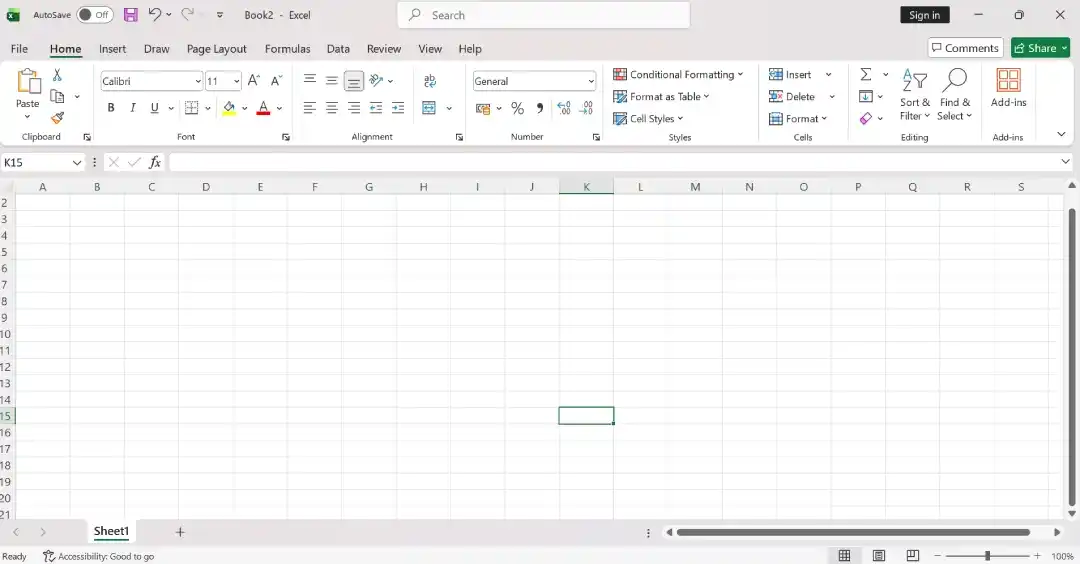
Understanding the Excel Interface
1. File Tab
The File tab is used for managing workbook-level tasks:
- New: Create a new workbook or use templates
- Open: Access previously saved workbooks
- Save / Save As: Save files with different names or formats
- Print: Adjust layout, margins, and printing settings
- Options: Customize Excel settings based on your preferences
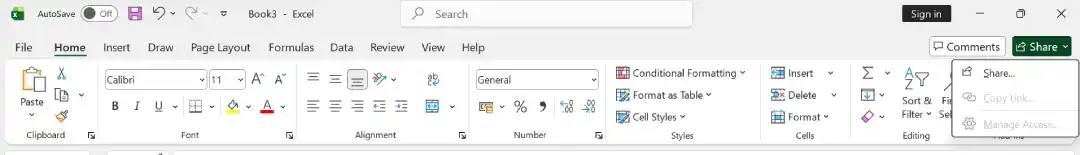
2. Home Tab
The Home tab is used for everyday spreadsheet operations:
- Clipboard: Cut, Copy, Paste, and Format Painter
- Font: Change font type, size, color, and styling
- Alignment: Align text vertically and horizontally
- Number: Format numbers, dates, and currency values
- Cells: Insert, delete, or format rows and columns
- Editing: Use Find & Select, Sort, and Filter tools
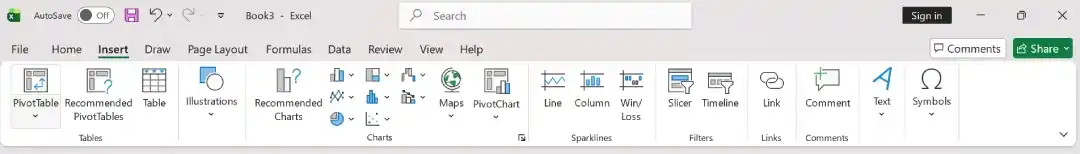
3. Insert Tab
The Insert tab allows you to add visual and structured elements:
- Tables: Convert raw data into structured tables
- Illustrations: Insert images, shapes, and icons
- Charts: Visualize data using charts
- Links: Add hyperlinks for navigation or references
- Text: Insert text boxes, headers, and footers
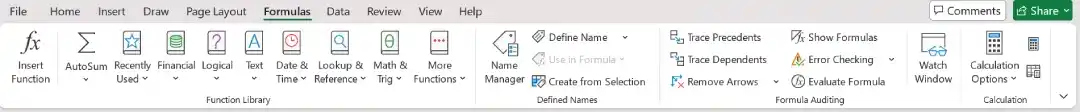
4. Formulas Tab
The Formulas tab is used for calculations and logic building:
- Function Library: Access hundreds of built-in functions
- Defined Names: Name cells or ranges for easier formulas
- Formula Auditing: Check and troubleshoot formulas
- Calculation Options: Choose automatic or manual calculation mode
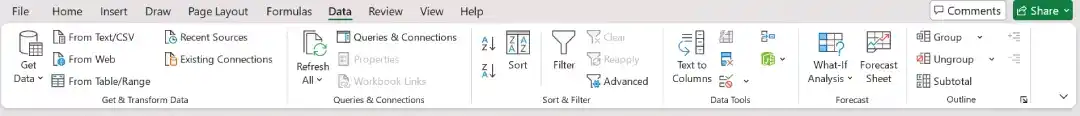
5. Data Tab
The Data tab is used for managing and analysing large datasets:
- Sort & Filter: Organise data based on conditions
- Data Tools: Use Data Validation and Remove Duplicates
- Connections: Connect Excel with external data sources
- Outline: Group data for structured viewing
Basic Navigation and Formatting
1. Navigating Cells
Excel works using rows and columns forming a grid. Each cell is identified using a cell reference (for example, A1 or B2). You can navigate by:
- Using arrow keys on the keyboard
- Clicking directly on cells using the mouse
2. Basic Formatting
Formatting improves readability and presentation.
- Font Options: Change font type, size, and color
- Alignment: Align text left, center, or right
- Text Formatting: Use bold, italic, underline, or color highlighting
- Cell Formatting: Apply background colors or borders
Example: Enter a name like Priya Bhartiya and apply center alignment for better presentation.
Inserting and Working with Data
1. Inserting Data
You can type data directly into cells.
Example: Enter text or numbers in cell A1.
To copy values across cells:
- Use the Fill Handle (small square at the bottom-right of a selected cell)
- Drag to fill adjacent cells
2. Inserting Charts
Charts help convert data into visual insights.
Steps:
- Go to the Insert tab
- Select chart types such as Bar Chart, Line Chart, or Pie Chart
Charts make analysis easier to understand and present.
Excel Automation Features
Excel provides many formulas for calculations.
Example:
- SUM: Adds values across rows or columns
- AutoSum: Quickly calculates totals
When formulas are copied to other cells, Excel automatically adjusts cell references.
Collaboration in Excel
1. Sharing Workbooks
You can share Excel files with others using the Share option. If the file is stored on cloud services like OneDrive:
- Multiple users can work on the same file
- Changes update in real time
2. Collaboration Features
Excel allows teams to:
- Add comments
- Track changes
- Provide feedback inside the workbook
These features help teams work faster and maintain version consistency across shared documents.