Excel automatically groups dates in PivotTables into categories like Months, Quarters, and Years to help you analyze time-based data efficiently. However, in some cases, you may want to display raw dates instead of grouped ones.
What is Date Grouping in a Pivot Table
When you drag a Date field into the Rows or Columns section of a PivotTable, Excel often auto-groups it by:
- Years
- Quarters
- Months
- Days
- Hours
- Minutes
- Seconds
While this is useful for high-level analysis, it can be problematic when you need to see individual dates.
Steps to Create a PivotTable in Excel
Lets first walk through the steps to create a basic PivotTable:
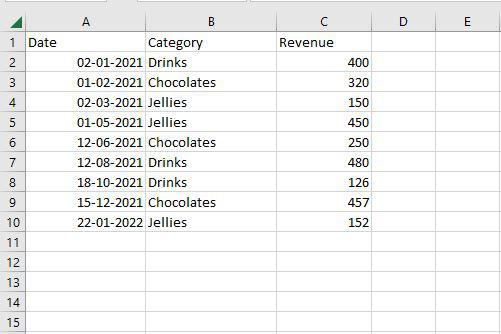
Step 1: Create an excel table with fields Date, Category, and Revenue.
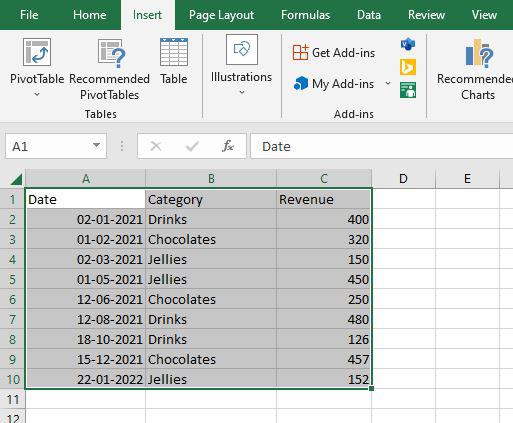
Step 2: Select the data. Navigate to the Insert tab on the top of the ribbon than in the Tables group select PivotTable.
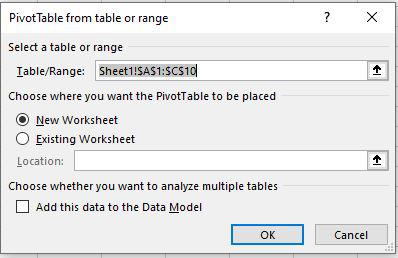
Step 3: PivotTable from the table or range dialog box appear. Here select the table range and select the new worksheet and then click on OK.
Step 4: Now you can see the Pivot table and Pivot table field pane in created. From the PivotTable fields pane, selects the Date and Revenue field.
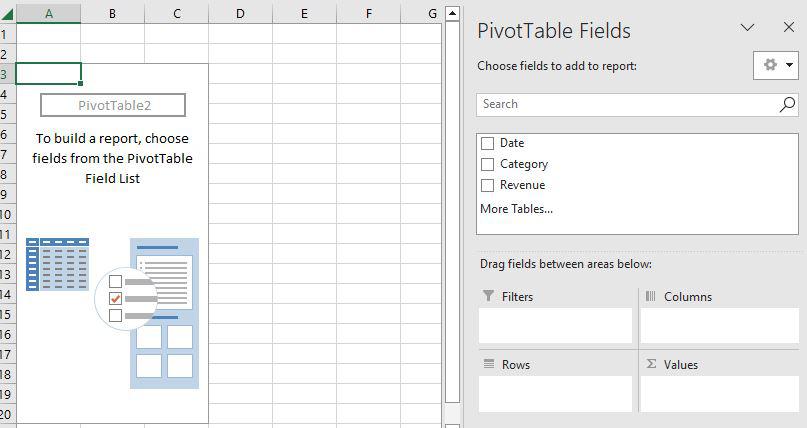
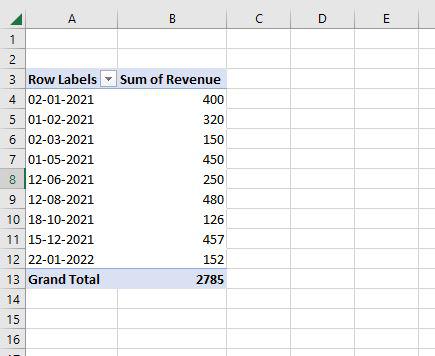
Step 5: Now as you can see, Pivot Table is created with the Date and the revenue field.
Group Dates by Month
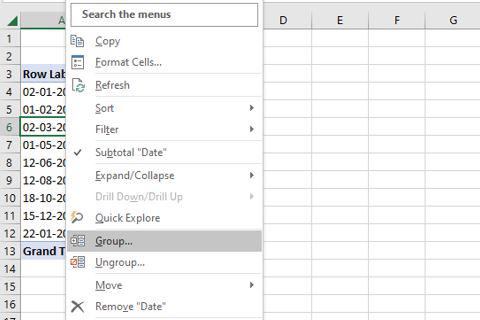
Step 1: Here select any date and then right-click on it. Here select the Group option.
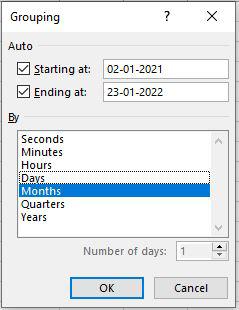
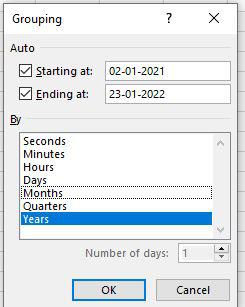
Step 2: Then Grouping dialog box will appear. Here, first fix the starting at and ending at then in the By pane select the Months option and then click on OK.
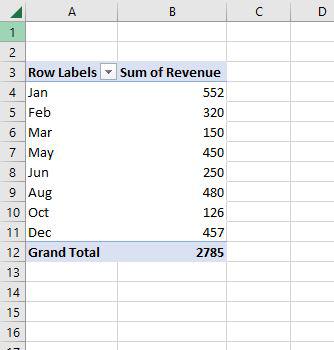
Step 3: Now you can see the table is showing only months with the revenue.
Group Dates by Years
Step 1: Now, right-click on the month and then choose a group option. Then Grouping dialog box will appear. Here first fix the starting at and ending at then in the By Pane select the Years option and then click on OK.
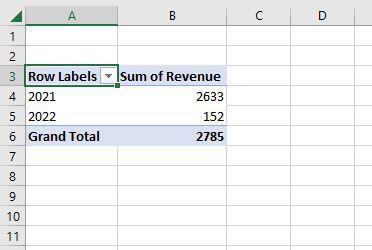
Step 2: Now you can see the table showing only years with the total revenue.
Group Dates by Quarters
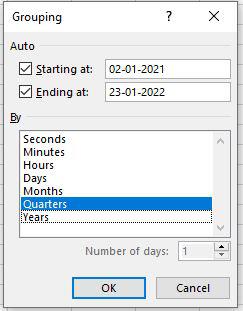
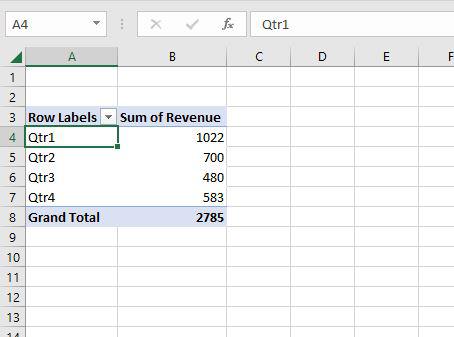
Step 1: Now, right-click on the Years and then choose a group option. Then Grouping dialog box will appear. Here first fix the starting at and ending at then in By Pane select the Quarters option and then click on OK.
Step 2: Now you can see the table showing only Quarters with the total revenue.
Group Dates by Days
Step 1: Now again right click on the Quarters and then choose a group option. Then Grouping dialog box will appear. Here first fix the starting at and ending at then in the By pane select the Days option and select Number of days. Here we are selecting 20 and then clicking on OK.
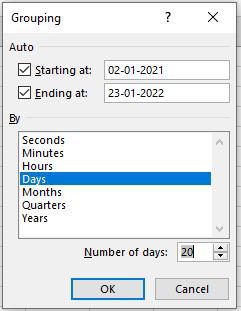
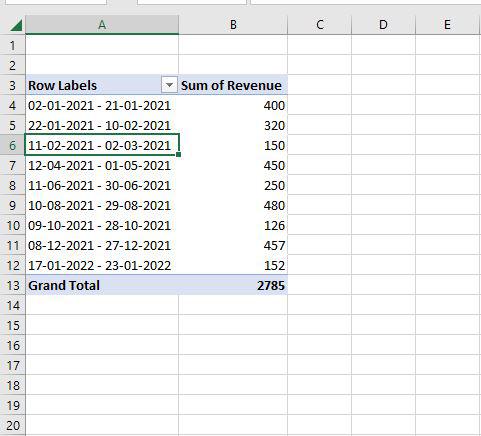
Step 2: Now you can see the table showing Dates in 20 days grouping with the revenue.
Group Dates by Seconds, Minutes, and Hours
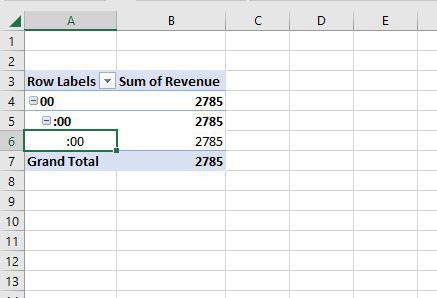
Step 1: Now again right click on the Days and then choose a group option. Then Grouping dialog box will appear. Here first fix the starting at and ending at then in the By pane select the Seconds, Minutes, and hours options. Then click on OK.
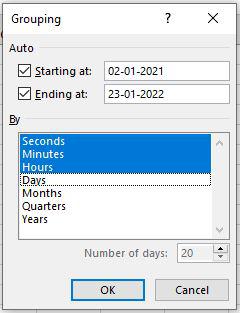
Step 2: Now you can see the table shows 00 in seconds, minutes, and hours. Because the time is not there in the pivot table. But it shows the total revenue.