In Excel, charts are visual representations of data that can be moved or resized for better clarity and presentation. By default, charts adjust their size with cells, but users can freely reposition them within a worksheet, move them to a new worksheet, or resize them using sizing handles. This helps prevent overlapping with data and ensures the chart fits neatly in the workbook.
Moving Charts in Excel
In Excel, We can easily move charts. Let us discuss with the help of an example. Suppose we have a chart that represents random sales data in different cities of 3 different states(You can use any dataset and insert a chart using the dataset and implement the following moving and resizing behavior). Now we will move this chart.
Move a chart within a worksheet
In this example, we will move a char within the same excel worksheet. Usually, we perform these operations in order to avoid the overlapping between the data and the charts. Following is the step-by-step implementation.
Step 1: Insert and Select the chart
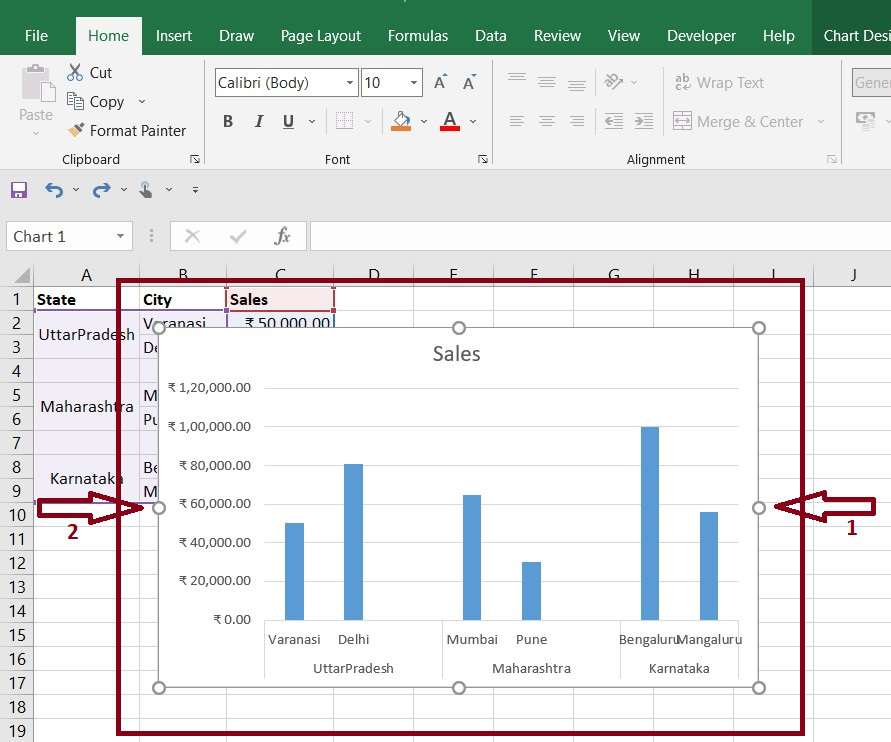
In this step, first, we'll need to insert a chart(Here, we are using Bar Chart). Once we have created a chart then we need to select it, for this, we have to click over our chart and select it.
Step 2: Position the chart
Once we have selected the chart, we can position the chat to a new location by dragging it using the chart's border (We can also do that by double-clicking to hold the chart and drag to a new position and rest it there).
Move a chart to another worksheet
In this example, we will learn to move our chart to a new worksheet. This will create a new worksheet with the specified sheet name and contains the chart. to do this follow the step by step implementation
Step 1: Insert and Select the chart
In this step, first, we will need to insert a chart(Here, we are using Bar Chart). Once we have created our chart we need to select it, for this, we have to click over the chart and select it.
Step 2: Position the char on a new worksheet
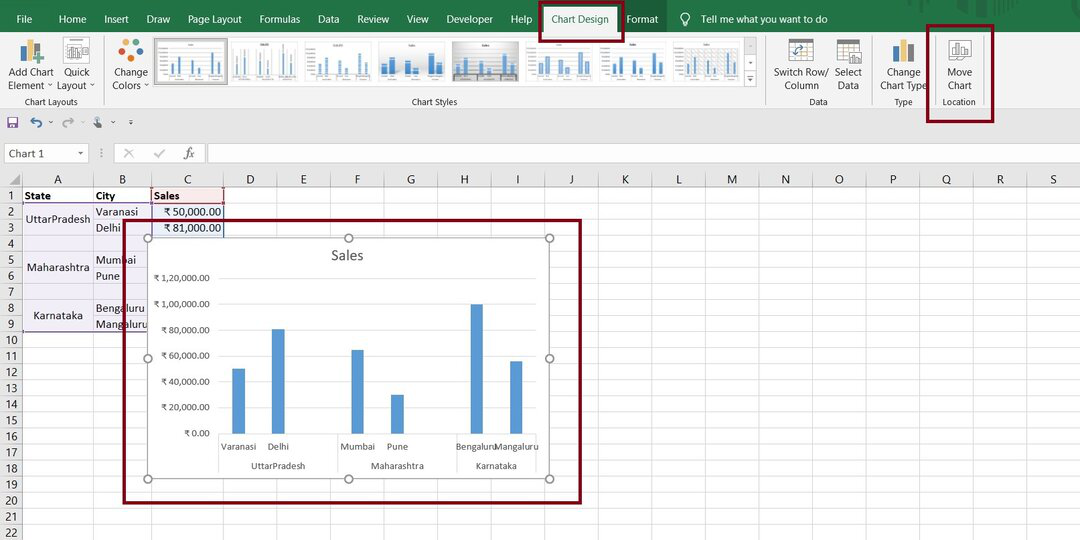
Once we have selected the chart we need to go to Chart Design > Move Chart it will pop up a window asking about the new position to place the chart.
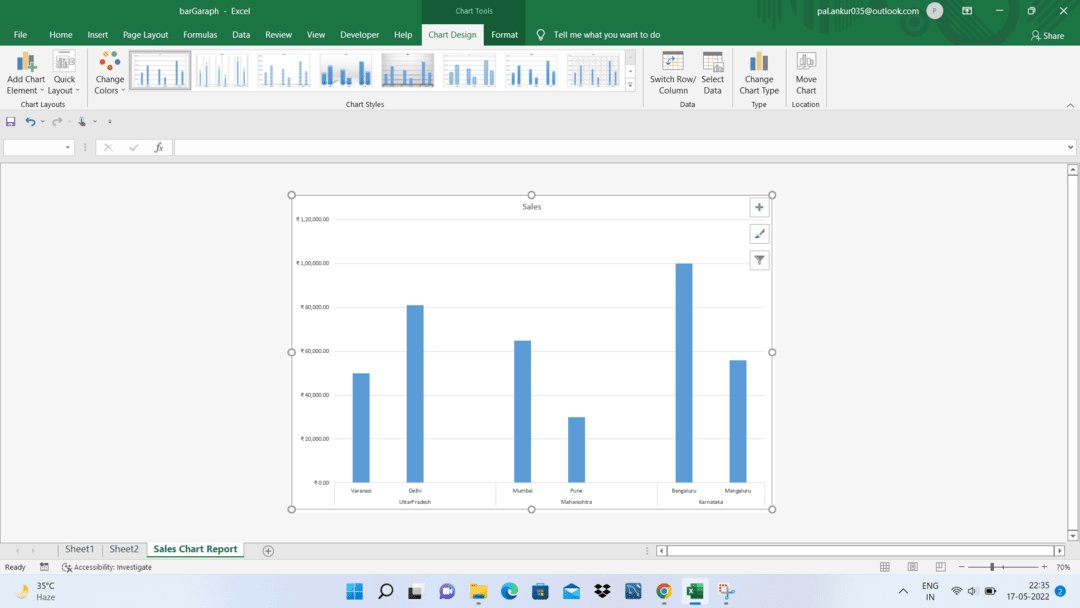
After we click on the Move Chart option, the excel will popup window where we need to put the new worksheet.
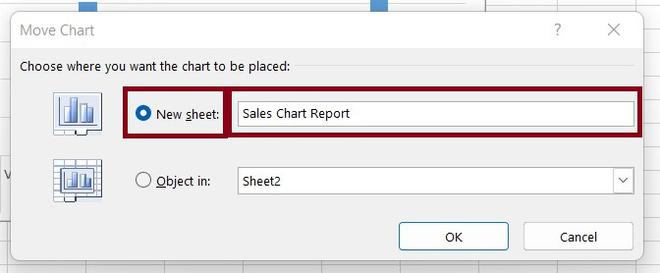
Once we click on the OK button excel will create a new worksheet with the name we have provided as "Sales Chart Report".
Resizing Charts in Excel
Resizing of the chart includes an increase or decrease in the length or breadth of the chart. This could be easily done by holding the graph's endpoint and dragging them to increase or decrease the size of the graph. Following is the step-by-step implementation.
Step 1: Insert and Select the chart
In this step, first, we will need to insert a chart(Here, we are using Bar Chart). Once we have created the chart we need to select it, for this, we have to click over our chart and select it.
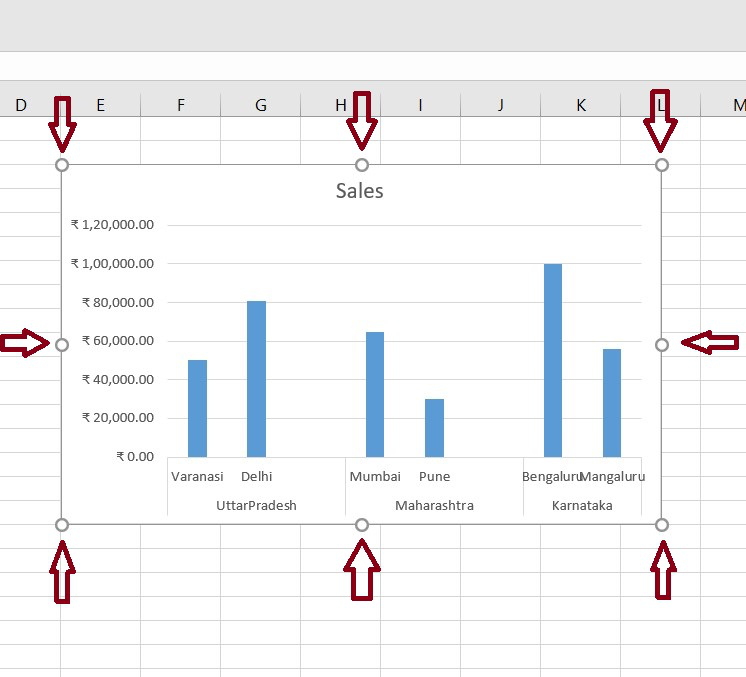
Step 2: Resizing the chart
In this step, we will resize the chart. For resizing the chart excel provides eight sizing handles in the chart. We can click on these handles and drag the size of the chart according to our requirements.