Alhamdulillah, our paper has been accepted for a satellite workshop of ICASSP 2025. This paper discusses "Pathological Voice Detection From Sustained Vowels: Handcrafted vs. Self-supervised Learning". We proposed to examine pathological voice detection from sustained vowels (/a/, /i/, /u/) both using acoustic features and self-supervised learning (SSL) models. We also evaluated early fusion (feature concatenation) and decision-level ensemble learning for both types of features.
Our work is highly beneficial to society, as it will help to improve the performance of pathological voice detection.
Several aspects were evaluated in this research project: evaluation of different vowels (which one leads to better results), evaluation of different acoustic and SSL features, and ensemble learning results.
Future work could tackle the limitations of the F1 score AUC by using more recent metrics like the Matthew correlation coefficient (MCC), which considers true and false positives and negatives.
Since the nature of the problem of detecting pathological voices can be classified as anomaly detection, future work can also be accomplished to observe the effectiveness of anomaly detection methods for pathological voice detection.
We extend our gratitude to AIST for their full support of our research, and to NEDO and JST for research funding.
Happy reading. We welcome your feedback. See you in Hyderabad!
URL for downloading the paper: (will be given after it is available or contact me to get the accepted version).
Are you interested in visualizing live audio data from your microphone? Do you want to see the waveform of your voice or any other sound in real time? In this blog post, we’ll explore a Python script that utilizes Matplotlib to plot live microphone signals. This script is a useful tool for understanding and analyzing audio input in real time.
Before we begin, make sure you have sounddevice, Matplotlib, and NumPy installed. If not, you can install them using the following command:
pip install matplotlib numpy sounddevice
Now, let’s dive into the code and see how it works.
The Code
#!/usr/bin/env python3"""Plot the live microphone signal(s) with matplotlib.Matplotlib and NumPy have to be installed."""import argparseimport queueimport sysfrom matplotlib.animation import FuncAnimationimport matplotlib.pyplot as pltimport numpy as npimport sounddevice as sd
The script starts with the usual shebang (#!/usr/bin/env python3) and a brief docstring explaining the purpose of the code. It also imports the necessary modules: argparse, queue, sys, FuncAnimation from matplotlib.animation, plt (alias for matplotlib.pyplot), numpy, and sounddevice.
Next, the code defines two helper functions and two main functions.
def int_or_str(text):"""Helper function for argument parsing."""try:returnint(text)exceptValueError:return textdef audio_callback(indata, frames, time, status):"""This is called (from a separate thread) for each audio block."""if status:print(status, file=sys.stderr)# Fancy indexing with mapping creates a (necessary!) copy: q.put(indata[::args.downsample, mapping])
The int_or_str function is a helper used for parsing command-line arguments. It tries to convert the input text to an integer and returns it if successful; otherwise, it returns the input text as it is.
The audio_callback function is called for each audio block received from the microphone. It receives indata (the audio data), frames (the number of frames), time (the timestamp of the audio data), and status (the status of the audio stream). It prints any status messages to the standard error and puts a copy of the audio data (filtered using downsampling and channel mapping) into a queue (q) for processing later.
def update_plot(frame):"""This is called by matplotlib for each plot update. Typically, audio callbacks happen more frequently than plot updates, therefore the queue tends to contain multiple blocks of audio data. """global plotdatawhileTrue:try: data = q.get_nowait()except queue.Empty:break shift =len(data) plotdata = np.roll(plotdata, -shift, axis=0) plotdata[-shift:, :] = datafor column, line inenumerate(lines): line.set_ydata(plotdata[:, column])return lines
The update_plot function is called by Matplotlib for each plot update. It retrieves audio data from the queue (q) and shifts the existing data to accommodate the new audio block. The function then updates the y-data of the lines on the plot with the new audio data.
if__name__=="__main__":# ... (continued in the next code block)
The script uses the standard Python if __name__ == "__main__": guard to ensure that the following code is only executed when the script is run directly, not when it’s imported as a module.
parser = argparse.ArgumentParser(add_help=False) parser.add_argument('-l', '--list-devices', action='store_true',help='show list of audio devices and exit') args, remaining = parser.parse_known_args()if args.list_devices:print(sd.query_devices()) parser.exit(0)
The code sets up an argument parser with argparse to handle command-line arguments. It allows the user to list available audio devices and exit the program without running the main functionality. If the user specifies the --list-devices flag, the script will print a list of audio devices using sd.query_devices() and then exit.
parser = argparse.ArgumentParser( description=__doc__, formatter_class=argparse.RawDescriptionHelpFormatter, parents=[parser]) parser.add_argument('channels', type=int, default=[1], nargs='*', metavar='CHANNEL',help='input channels to plot (default: the first)') parser.add_argument('-d', '--device', type=int_or_str,help='input device (numeric ID or substring)') parser.add_argument('-w', '--window', type=float, default=200, metavar='DURATION',help='visible time slot (default: %(default)s ms)') parser.add_argument('-i', '--interval', type=float, default=30,help='minimum time between plot updates (default: %(default)s ms)') parser.add_argument('-b', '--blocksize', type=int, help='block size (in samples)') parser.add_argument('-sr', '--samplerate', type=float, default=16000, help='sampling rate of audio device') parser.add_argument('-n', '--downsample', type=int, default=1, metavar='N',help='No downsample (default: %(default)s)') args = parser.parse_args(remaining)
The script creates another argument parser, this time with a description based on the script’s docstring. It defines several command-line arguments:
channels: The channels to plot. If not specified, it will default to the first channel.
device: The input audio device to use. It can be specified either by a numeric ID or a substring of the device name.
window: The visible time slot in milliseconds. This controls how much of the audio history is displayed on the plot.
interval: The minimum time between plot updates in milliseconds.
blocksize: The block size (number of samples) for audio processing. If not specified, the default block size of the audio stream will be used.
samplerate: The sampling rate of the audio device. If not specified, it will default to 16000 Hz.
downsample: The factor by which the audio data is downsampled. By default, no downsampling is applied.
The parse_args method is called to parse the remaining command-line arguments (remaining) after handling the --list-devices option.
ifany(c <1for c in args.channels): parser.error('argument CHANNEL: must be >= 1') mapping = [c -1for c in args.channels] # Channel numbers start with 1 q = queue.Queue()
The code checks if any of the specified channels are less than 1. If so, it raises an error with an appropriate message. It then creates a mapping list for the channel indices, as the channel numbers in args.channels start from 1.
Full code is listed below. Actually, it is based on an example from sounddevice documentation [1].
#!/usr/bin/env python3
"""Plot the live microphone signal(s) with matplotlib.

Matplotlib and NumPy have to be installed.

"""
import argparse
import queue
import sys

from matplotlib.animation import FuncAnimation
import matplotlib.pyplot as plt
import numpy as np
import sounddevice as sd
def int_or_str(text):
    """Helper function for argument parsing."""
    try:
        return int(text)
    except ValueError:
        return text


def audio_callback(indata, frames, time, status):
    """This is called (from a separate thread) for each audio block."""
    if status:
        print(status, file=sys.stderr)
    # Fancy indexing with mapping creates a (necessary!) copy:
    q.put(indata[::args.downsample, mapping])
def update_plot(frame):
    """This is called by matplotlib for each plot update.

    Typically, audio callbacks happen more frequently than plot updates,
    therefore the queue tends to contain multiple blocks of audio data.

    """
    global plotdata
    while True:
        try:
            data = q.get_nowait()
        except queue.Empty:
            break
        shift = len(data)
        plotdata = np.roll(plotdata, -shift, axis=0)
        plotdata[-shift:, :] = data
    for column, line in enumerate(lines):
        line.set_ydata(plotdata[:, column])
    return lines
if __name__ == "__main__":
    parser = argparse.ArgumentParser(add_help=False)
    parser.add_argument(
        '-l', '--list-devices', action='store_true',
        help='show list of audio devices and exit')
    args, remaining = parser.parse_known_args()
    if args.list_devices:
        print(sd.query_devices())
        parser.exit(0)
    parser = argparse.ArgumentParser(
        description=__doc__,
        formatter_class=argparse.RawDescriptionHelpFormatter,
        parents=[parser])
    parser.add_argument(
        'channels', type=int, default=[1], nargs='*', metavar='CHANNEL',
        help='input channels to plot (default: the first)')
    parser.add_argument(
        '-d', '--device', type=int_or_str,
        help='input device (numeric ID or substring)')
    parser.add_argument(
        '-w', '--window', type=float, default=200, metavar='DURATION',
        help='visible time slot (default: %(default)s ms)')
    parser.add_argument(
        '-i', '--interval', type=float, default=30,
        help='minimum time between plot updates (default: %(default)s ms)')
    parser.add_argument(
        '-b', '--blocksize', type=int, help='block size (in samples)')
    parser.add_argument(
        '-sr', '--samplerate', type=float, default=16000, help='sampling rate of audio device')
    parser.add_argument(
        '-n', '--downsample', type=int, default=1, metavar='N',
        help='No downsample (default: %(default)s)')
    args = parser.parse_args(remaining)
    if any(c < 1 for c in args.channels):
        parser.error('argument CHANNEL: must be >= 1')
    mapping = [c - 1 for c in args.channels]  # Channel numbers start with 1
    q = queue.Queue()
try:
if args.samplerate is None:
device_info = sd.query_devices(args.device, 'input')
args.samplerate = device_info['default_samplerate']
length = int(args.window * args.samplerate / (1000 * args.downsample))
plotdata = np.zeros((length, len(args.channels)))
fig, ax = plt.subplots()
lines = ax.plot(plotdata)
if len(args.channels) > 1:
ax.legend([f'channel {c}' for c in args.channels],
loc='lower left', ncol=len(args.channels))
ax.axis((0, len(plotdata), -1, 1))
ax.set_yticks([0])
ax.yaxis.grid(True)
ax.tick_params(bottom=False, top=False, labelbottom=False,
right=False, left=False, labelleft=False)
ax.text(0.01, 0.99, f'Sample rate: {args.samplerate/args.downsample} Hz', transform=ax.transAxes, va='top', ha='left')
fig.tight_layout(pad=0)
stream = sd.InputStream(
device=args.device, channels=max(args.channels),
samplerate=args.samplerate, callback=audio_callback)
ani = FuncAnimation(fig, update_plot, interval=args.interval, blit=True)
with stream:
plt.show()
except Exception as e:
parser.exit(type(e).__name__ + ': ' + str(e))
Save it as sd_plot_input.py (or whatever name.py) and run it with the following commands. See the video above for the sample output.
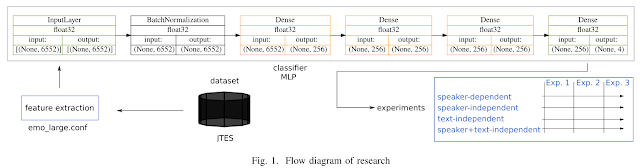
Traditional speech emotion recognition (SER) evaluations have been performed merely on a speaker-independent (SI) condition; some of them even did not evaluate their result on this condition (speaker-dependent, SD). This paper highlights the importance of splitting training and test data for SER by script, known as sentence-open or text-independent (TI) criteria. The results show that employing sentence-open criteria degraded the performance of SER. This finding implies the difficulties of recognizing emotion from speech in different linguistic information embedded in acoustic information. Surprisingly, text-independent criteria consistently performed worse than speaker+text-independent (STI) criteria. The full order of difficulties for splitting criteria on SER performances from the most difficult to the easiest is text- independent, speaker+text-independent, speaker-independent, and speaker+text-dependent. The gap between speaker+text- independent and text-independent was smaller than other criteria, strengthening the difficulties of recognizing emotion from speech in different sentences.
Method
Experiment #1: average of 30 trials (runs)
Experiment #2: 5-fold cross-validation
Experiment #3: Same number of training and test data
Result
Take home message
Sentence (or linguistic) information plays a crucial role in speech emotion recognition.
This study proposes an automatic naturalness
recognition from an acted dialogue. The problem can be stated that:
given speech utterances with their naturalness labels, is it possible
to recognize these labels automatically? By what methods? And
how to evaluate these methods? We evaluated two supervised
classifiers to investigate the possibility of recognizing naturalness
automatically in acted speech: long short-term memory and
multilayer perceptron neural networks. These classifiers accept
inputs in the form of acoustic features from a speech dataset.
Two kinds of acoustic features were evaluated: low-level and
high-level features. This initial study on automatic naturalness
recognition of speech resulted in a moderate performance of the
assessed systems. We measured the performance in concordance
correlation coefficients, Pearson correlation coefficients, and root
mean square errors. This study opens a potential application
of speech processing techniques for measuring naturalness in
acted dialogue, which benefits for drama- or movie-making in
the future.
Planning a research is the first step to authoring a Ph.D. The next steps are drafting, writing and finishing a doctoral thesis or dissertation. However, the first step is the most important. We'll never walk through 1000 steps if we don't walk on the first step. A journey of a thousand miles begins with a single step. Right..?
So, let's start. The research plan should include as following order;
Theme (one sentence, almost the same as the title)
Backgrounds (problems, previous reports for each problem, advantage/disadvantage of the previous research (if not separated in "previous work", remaining problems, final target)
Purpose (your tackling problem (what/why), a main goal (a single purpose that must be achieved), sub-goals (should be achieved) to achieve the main goal)
Methodology (how to achieve each subgoal, how to combine these to achieve the final purpose)
Expected results and contributions.
That's all that I got from my supervisor here. Great! So, let's move to the next step.
Tulisan ini bukan tentang "perkenalan dengan emosi" namun tentang seri pengenalan emosi (secara otomatis, khususnya dari ujaran/speech). Tulisan pertama ini berkenaan dengan jenis-jenis pembagian emosi dan alasan dibalik pembagian tersebut.
Emosi manusia terbagi menjadi beberapa jenis. Pembagiannya pun beragam, tergantung siapa dan berdasarkan apa dia membaginya. Tentunya yang membagi adalah orang yang ahli dibidangnya, misalnya psikolog, psikiater, atau neuropsikolog.
Pembagian emosi secara diskirt (Sumber: Wikipedia)
Sound source separation is challenging problem in acoustics area. The problem comes from the cocktail
party, presence of multi talker and the ability of human ear to focus and separate voice from many sources.
Some approaches have been developed to separate mixed sound from sources. The estimation of
fundamental frequency is one of approach to decompose mixture sounds into its components based on its
harmonics. The idea is by grouping the components which has the same harmonics from the mixture
sound by pitch and common amplitude modulation and harmonic selection technique. The estimation of
fundamental frequency itself is challenging problem which in progress as well as sound separation
problem. The result of those methods clearly shown that F0-based sound separation works efficiently,
especially in musical sounds. However, the method needs to be improved in other conditions such as
noisy and reverberant.
Full paper (in Indonesian language) can be downloaded here.
Matlab source code can be obtained from here.