Monitoring in system design ensures a system remains healthy, reliable, and high-performing. It continuously collects and analyzes data to provide real-time visibility into the internal state of distributed applications.
- Monitoring helps detect issues before they affect users, ensuring high system reliability and smooth performance.
- It provides real-time visibility into system health, turning a complex system from a black box into a glass box for better decision-making.
Three Pillars Of Monitoring
A comprehensive monitoring strategy is built on collecting three distinct types of data.
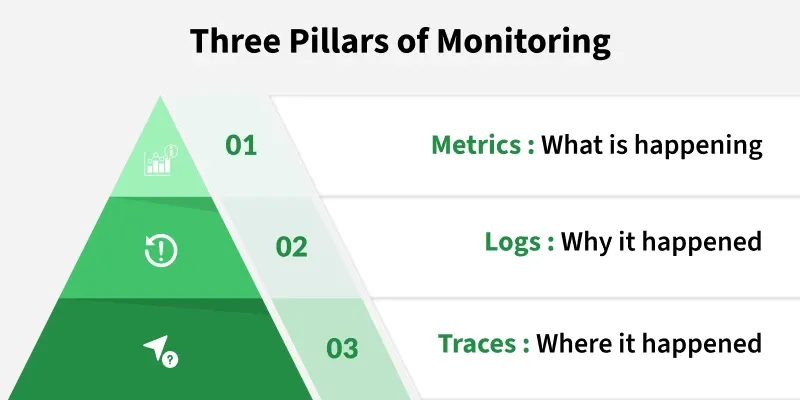
1. Metrics
Metrics are numerical, time-series data points measured over intervals. They are lightweight, easy to store, and excellent for dashboards and alerts. They tell you what is happening and how much.
Purpose
- Detect performance issues using thresholds and trends.
- Monitor system health and resource utilization.
Examples
- CPU utilization (e.g.,
85%) - Request latency (e.g.,
250ms) - HTTP error rate (e.g.,
5% 5xx errors) - Disk I/O, memory usage, network bandwidth
Tools
- Prometheus, InfluxDB, Grafana (for visualization).
Note: Metrics give a quick, high-level overview of the system.
2. Logs
Logs are immutable, timestamped text records of discrete events. They are verbose and provide detailed, human-readable context. If a metric tells you "error rate spiked," a log will tell you the exact error message for a specific failed request.
Purpose
- Troubleshoot failures and unexpected behaviour.
- Audit security-related events.
- Perform deep investigation after incident.
Examples
[2025-10-24 07:15:01] ERROR: User login failed — invalid password
[2025-10-24 07:16:05] INFO: Payment service connected to database
Tools
- ELK Stack (Elasticsearch, Logstash, Kibana), Splunk, Graylog, Loki.
Note: Metrics alert you to a problem; logs help you understand the problem.
3. Traces
Traces are the "secret sauce" for microservices. A single trace shows the end-to-end journey of a request as it "traces" its path through multiple, distributed services. It's a "log of logs" for a single request, showing how long it spent in each service.
Purpose
- Identify performance bottlenecks.
- Debug latency in distributed system.
Examples
A user request took 500ms total:
- Load Balancer: 50ms
- Auth Service: 150ms
- Order Service: 300ms - bottleneck
This reveals where optimization is needed.
Tools
- Jaeger, Zipkin, OpenTelemetry.
Note: Traces give a microservices map, showing exactly where slowdown or failure occurs.
Monitoring Philosophies
Monitoring philosophies define whether issues are detected after they occur (reactive) or prevented before they impact users (proactive).
1. Reactive monitoring
Reactive monitoring alerts you after something has already gone wrong in the system. It focuses on detecting known issues and notifying teams quickly.
Purpose
- Minimize downtime by responding fast to failures
Example
- CPU usage reaches 100% → Alert triggers → Engineer fixes it
Benefits
- Simple to implement
- Helps with critical issue response
Challenges
- Alerts come after users are impacted
- Doesn’t prevent failures
- Can cause reputation/financial loss if slow to react.
Note: Effective, but only as a first line of defense.
2. Proactive Monitoring - “Weather Forecast Approach"
Proactive monitoring identifies early warning signs and prevents failures before they happen. It uses trend analysis and predictions.
Purpose
- Prevent performance degradation and outages.
- Improve long-term system reliability.
Example
- Disk usage increasing steadily - Alert: “Disk will be full in 3 days” - Fix before failure
Benefits
- Reduces downtime and user impact.
- Supports capacity planning and resource optimization.
Challenges
- Requires smart analytics and accurate thresholds.
- Risk of false alerts if poorly configure.
Note: Helps build highly reliable and self-aware system.
Reactive monitoring Vs Proactive Monitoring
A comparison of detecting failures after they occur versus preventing them before they impact users.
| Feature | Reactive Monitoring | Proactive Monitoring |
|---|---|---|
| When alert triggers | After failure | Before failure |
| User Impact | Already affected | Not affected |
| Difficulty level | Easy | Complex |
| Best for | Incident response | Reliability + prevention |
Key Monitoring Domains
Monitoring spans different layers of the system. Each domain focuses on specific components to ensure complete visibility and reliability.
1. Infrastructure (Health) Monitoring
This is the foundation. It involves monitoring the health and performance of your physical or virtual hardware.
Purpose
- To ensure the underlying compute, storage, and network resources are healthy.
Metrics
- CPU, RAM, disk space, disk I/O, network in/out.
Tools
- Prometheus, Nagios, Zabbix, Datadog.
2. Application Performance Monitoring (APM)
APM focuses on monitoring the performance of the software application itself, from the code level.
Purpose
- To identify application-level bottlenecks, code inefficiencies, and errors.
Metrics:
- Request/transaction latency, error rates (HTTP 500s), throughput (requests per second), database query times.
Tools
- New Relic, Dynatrace, AppDynamics.
3. Log Monitoring (Log Management)
This involves collecting, centralizing, and analyzing log data from all parts of your system.
Purpose
- To enable troubleshooting, auditing, and querying of historical event data.
Benefits
- Helps find exact failure reasons.
- Useful for auditing and tracing user actions.
Challenges
- Log volume can be massive, making storage and analysis expensive. Parsing unstructured logs is difficult.
Tools
- ELK Stack, Splunk, Loki, Graylog.
4. Security Monitoring (SIEM)
This involves monitoring system activities to detect, respond to, and neutralize security threats.
Purpose
- To protect systems and data from unauthorized access, breaches, and malicious activities.
Activities
- Monitoring for suspicious login attempts, analyzing network traffic for intrusions, and checking file integrity.
Tools
- Security Information and Event Management (SIEM) platforms, Intrusion Detection Systems (IDS), Wazuh.
5. User Experience Monitoring (Frontend/Client-Side)
This is critical as it measures what the user actually experiences. It has two main sub-types:
Real User Monitoring (RUM)
- Measures the actual performance of your application from the browsers of your real end-users. It answers, "How long did the page take to load for users in India on a mobile device?"
Synthetic Monitoring
- Uses scripts or bots to simulate user journeys (e.g., "log in," "add to cart," "checkout") from different locations around the world, 24/7. This helps you catch problems before real users do.
6. Business Monitoring
This involves tracking high-level business metrics (Key Performance Indicators or KPIs) alongside technical metrics.
Purpose
- To connect system health directly to business outcomes.
Examples
- Monitoring "user signups per hour," "items sold per minute," or "cart abandonment rate." A drop in "signups per hour" is a much more powerful alert than "CPU is at 80%."
Effective Monitoring Practices
- Define SLOs/SLIs/SLAs for clear reliability goals.
- Alert on user-impacting symptoms, not low-level causes.
- Avoid alert fatigue with only actionable alerts.
- Use role-based dashboards for better visibility.
Use SLOs, SLIs, and SLAs
Use SLOs, SLIs, and SLAs to define measurable service goals, track performance, and ensure reliability commitments to users.
| Term | Meaning | Example |
|---|---|---|
| SLI | What we measure | Login success rate |
| SLO | Target level | 99.9% logins succeed |
| SLA | Customer guarantee | Penalty if SLO not met |
Alert on Symptoms, Not Causes
- Bad Alert (Cause): "CPU on server
web-05is at 95%." (This might not even be a problem. Who cares?) - Good Alert (Symptom): "The p99 latency for the
/loginendpoint is over 800ms for 5 minutes." (This directly impacts users. The high CPU is just a clue for why.)
Avoid Alert Fatigue
- If you get too many "noisy" or non-actionable alerts, you will start to ignore them (the "boy who cried wolf" problem).
- Make every alert actionable. It should represent a real problem that requires a human to investigate.
Use Dashboards for Different Audiences
- Executive Dashboard: High-level business KPIs and system uptime.
- Engineering Dashboard: Detailed service-level metrics (latency, error rates, saturation).
- Debug Dashboard: Granular, instance-level metrics (CPU, RAM) for deep dives.