DPF is up to his usual tricks again, this time with a graph of government revenue over the past six years being used as a rhetorical prop to argue for (what else?) tax cuts for the rich. But as usual, he's being more than a little misleading - and quite deliberately so.
Firstly, there is the use of nominal (dollar) figures and total crown revenue and expenditure statistics. But as I've pointed out before, this is grossly misleading. Nominal figures inflate the difference between past and present expenditure by failing to correct for inflation or GDP growth. Because of this, the proper way to compare government spending and revenue over time is as a percentage of GDP growth, rather than in nominal dollars. "Total crown" figures include not only government spending and revenue, but also every dollar earned and spent by SOEs and crown entities. As much as the right would like to pretend, growth in this statistic (or at least the SOE and Crown Entity component) is not a sign of expanding government, and it does not represent government spending which could be "returned to taxpayers" as tax cuts. Instead, it is the result of growth in government-owned businesses - which to the extent it represents an increase in the government's wealth, and in its dividend income, is something we should welcome.
(I should add that a large part in the growth in total revenue in 2006 is due to exactly this reason. In its fiscal outlook [PDF], the December 2006 Half Year Economic & Fiscal Update noted that SOEs and Crown Entities made "large investment gains, resulting from strong global equity markets and one-off gains on sale of physical assets". These amounted to about 1.3% of GDP).
So, DPF is being misleading. As a former spindoctor, it was his job to mislead, and I guess old habits die hard. But he has included some valid statistics in the form of taxation revenue as a percentage of GDP, which does show an increase, both over time, and over the last year. Does this alone prove his point?
No. As the table below shows, the increase in 2006 DPF relies upon to prove his point was a one-off:
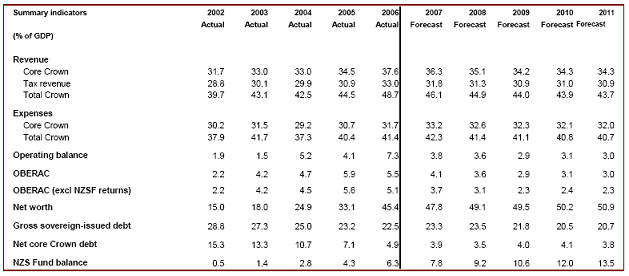
(Stolen from the December 2006 HYEFU Forecast Financial Statements [PDF])
The 2006 Budget Forecast Financial Statements [PDF] predicted 2006 tax revenue to be 31.7% of GDP. It turned out to be much higher, but is expected to decline thereafter to a long-term average of about 31% of GDP. This is an increase since 2000, but not as much as DPF makes out. Part of that increase (about 1% of GDP) is due to fiscal drag (which the government is finally moving to eliminate); the rest is due to a policy decision to make the tax system more progressive by taxing the rich more to fund public services for all - something I don't think anyone should be apologising for.
As for the source of this windfall, comparing the budget and half-yearly fiscal updates is informative. Essentially, it came about to due a far stronger economy than expected. Higher growth in wages due to the tight labour market and unions pushing for increases resulted in individual taxes being $746 million more than expected. But the real surprise is in corporate taxation: this was up by $1.36 billion - 15%! - due to strong economic growth and higher corporate profits. This won't last - corporate taxes follow the business cycle and have already returned to forecast levels, but in the meantime its a nice little windfall - and all the more startling when you remember that corporate taxes amount to on average 18% of tax revenues - compared to 48% for personal taxes.
As for DPF, when you dig into it, his argument boils down to two claims, that a) a one-off (but not enormous compared to the size of the overall budget) windfall justifies a significant permanent reduction in revenue; and b) that the rich need a tax cut because they're doing so well at the moment. Needless to say, I don't think either argument holds water. But then, I'm not a member of the National Party...