Showing posts with label culture. Show all posts

Thursday, July 8, 2010

The Company You Keep

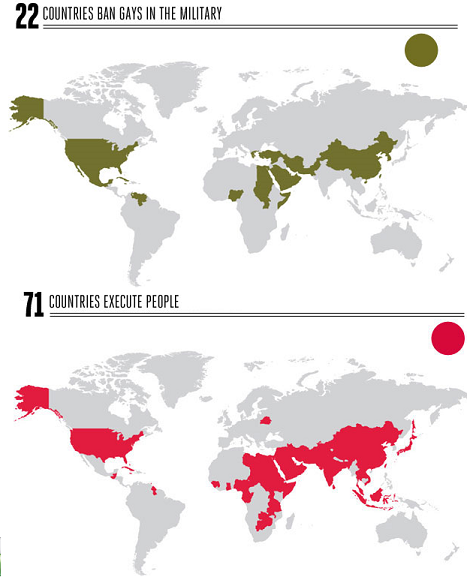
A provocative series of maps from Esquire's politics blog depicts the countries of the world according to a couple of controversial policies:

gays military capital punishment world map

The countries that ban gays in the military, according to Esquire, are Cuba, China, Egypt, Greece, Iran, Jamaica, Mexico, Nigeria, North Korea, Pakistan, Saudi Arabia, Singapore, Somalia, South Korea, Sudan, Syria, Turkey, United Arab Emirates, Uganda, United States, Venezuela, and Yemen

The countries that execute people are Afghanistan, Antigua and Barbuda, Bahamas, Bahrain, Bangladesh, Barbados, Belarus, Belize, Botswana, Burundi, Cameroon, Chad, China, Comoros, Congo, Cuba, Dominica, Egypt, Equatorial Guinea, Eritrea, Ethiopia, Gabon, Ghana, Guatemala, Guinea, Guyana, India, Indonesia, Iran, Iraq, Israel, Jamaica, Japan, Jordan, Kuwait, Laos, Lebanon, Lesotho, Libya, Malawi, Malaysia, Mongolia, Nigeria, North Korea, Oman, Pakistan, Palestinian Authority, Qatar, Saudi Arabia, Sierra Leone, Singapore, Somalia, South Korea, St. Kitts and Nevis, St. Lucia, St. Vincent and the Grenadines, Sudan, Swaziland, Syria, Taiwan, Tajikistan, Tanzania, Thailand, Trinidad and Tobago, Uganda, United Arab Emirates, United States, Vietnam, Yemen, Zambia, and Zimbabwe

And the countries that do both:
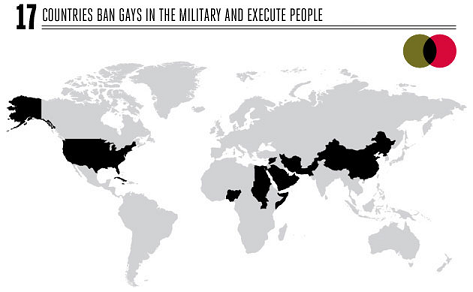
countries ban gays in the military and execute people

That is some pretty rarefied company for the United States: Cuba, China, Egypt, Iran, Jamaica, Nigeria, North Korea, Pakistan, Saudi Arabia, Singapore, Somalia, Sudan, Syria, United Arab Emirates, Uganda, and Yemen. The US's only company in the Western hemisphere are Cuba and Jamaica. Other than that it's just a handful of countries in Africa, a handful of countries in the Muslim Middle East, and a few in East Asia. No European countries on the list. The only other developed country is Singapore.

But all this is likely to change as the gears of the military bureaucracy seem to be slowly but inexorably grinding towards repeal of Don't Ask-Don't Tell. In which case the US will join only one other country in the executes-people-but-allows-gays-in-the-military pile: Israel.

What I find most interesting here, though, is the matter of American exceptionalism. To the extent that this term refers to the tendency of the US to embrace more authoritarian-conservative policies, it turns out the US isn't all that exceptional - except within the Western World (i.e., for these purposes, Europe + Latin America + Anglophone settler countries). It joins with a geographically coherent coterie of nations in clusters across parts of Africa, the Middle East, and much of South and East Asia.

But these areas couldn't be more unlike eachother - politically, culturally, linguistically, historically, religiously, geographically... They just tend to be alike in embracing more authoritarian policies. This consistent authoritarianism just seems to be independent of any other variable. Odd. (Of course, you could also take the view that the anti-authoritarianism of Europe and Latin America and perhaps part of Africa is exceptional, and what needs explaining.)

Tuesday, March 9, 2010

Fast Food Nation

Stephen Von Worley, burger cartographer extraordinaire, has created a map that presents fast food dominance across US territory in delectably manichean terms:

hamburger map of the us

Not wrongly, Von Worley frames the Empire of the Gilded Parabola as evil and (more wrongly) the other fast food outlets as a scrappy alliance of insurgents. Says he:
In this and the following graphic, each individual restaurant location has equal power. The entity that controls each point casts the most aggregate burger force upon it, as calculated by the inverse-square law – kind of like a chart outlining the gravitational wells of galactic star clusters, but in an alternate, fast food universe.

By far, the largest pocket of resistance is Sonic Drive-In’s south-central stronghold: more than 900 restaurants packed into the state of Texas alone. Sheer density is the key to victory!

The rebels already have the numbers – over 24,000 locations in total – but they’ve divided and conquered themselves by strict adherence to the peacetime principles of brand identity and corporate structure. This is war, and for the sake of self-preservation, all must be sacrificed! Kings and Queens: get used to hanging with the common folk. Tone down the sarcasm, Jack. And everyone, please, stop yanking Wendy’s pigtails! Y’all need to work in harmony to succeed with the winning strategy: an Alliance!
I.e., black space is McDonalds land. The only other contiguous territory of any real scale belongs to Sonic, across much of Texas and subsidiary areas. But Jack in the Box shows some strength in the Southwest, Burger King's got a far-flung string of outposts from the Southeast to the Northwest, and even Hardee's puts up a fight in the Carolinas. Dairy Queen, which I had always thought of as sort of the village pub of small Texas towns, actually looks to be even stronger in precisely the areas of the Upper Midwest which are most prone to actual blizzards.

Go to Von Worley's post to see another map that shows that as a combined force, the upstarts swamp the McHegemon.

Via Andrew Sullivan.

Sunday, January 10, 2010

Netflixography

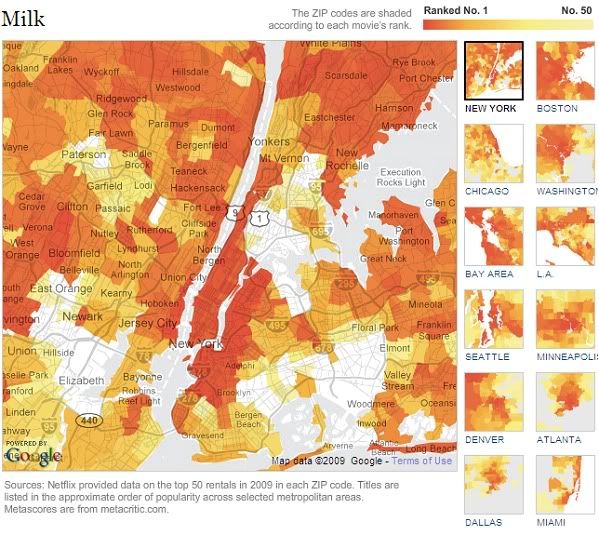
The New York Times raided Netflix's queue data and came up with this:

netflix rental popularity map

It shows Netflix rental patterns by zipcode in twelve great American cities, plus Dallas. Shown above is the popularity of Gus Van Sant's Milk in New York City. They've got maps for the current top 50 rentals for every zip code in all 13 cities, which is kind of nuts.

A few patterns tend to recur. In particular (based on my limited knowledge of the geography of these cities, especially NYC, which I know best) a lot of titles seem to fit into one of three categories:

Movies that are popular in wealthy urban areas: the yuppie and hipster neighborhoods. Includes Burn After Reading, The Wrestler, Milk (they're not big fans in surburban Atlanta), Revolutionary Road (but suburbs, too), Rachel Getting Married, Pineapple Express, Vicky Cristina Barcelona, W., Sunshine Cleaning, Religulous, Man on Wire, and Mad Men: Season 1.

Movies that are popular in poorer or working class urban areas . Includes Seven Pounds, Twilight, Body of Lies, Eagle Eye, The Soloist, Wanted, Pride and Glory, Push, Obsessed, Transporter 3 (never heard of this franchise), The Taking of Pelham 123 (only 31st most popular in Pelham), and RocknRolla.

Movies that are popular in suburbs. Includes Gran Torino, The Proposal, Mall Cop, Taken (never heard of it), Defiance, Nights in Rodanthe (city people hate it!), Yes Man, Marley and Me, Last Chance Harvey, Australia, and Bride Wars.

Lots of movies don't fit any of those patterns, of course, including I Love You, Man, The Dark Knight, and Watchmen. New in Town is just hugely popular in Minneapolis and nowhere else. And The Curious Case of Benjamin Button is inexplicably popular pretty much everywhere.

Thursday, April 23, 2009

Anti-Miscegenation Laws: A Precursor to Gay Marriage Bans?

So I was thinking about this map of the future of gay marriage, and wondering about what sort of precedents there might be in American social history for the sort of change involved in allowing gay couples to marry. And the best parallel to the legalization of gay marriage I can think of is the repeal of anti-miscegenation laws. Here's a map of the history of the repeal of anti-miscegenation laws.


There are obviously a ton of differences between the social acceptance of interracial marriages and the social acceptance of same-sex marriages. For one thing, the history of relations between races varies considerably between different regions of the country. But the basic shift in perceptions that undergird both expansions of social acceptance is pretty much the same: in both cases, the institution of marriage expands to include relationships that had once been seen as taboo. And the maps of the repeal of anti-miscegenation laws and the predicted failure of gay marriage bans (shown below) show a lot of correlation. In both cases, the socially progressive view takes hold first in the Northeast, and the South is the last holdout. In fact, every single state in the South continued to ban inter-racial marriage until the Supreme Court declared it unconstitutional in the case of Loving v. Virginia in 1967. It wouldn't surprise me terribly if a lot of Southern states continue to hold out against same-sex marriage until a comparable future Supreme Court decision.

But there are differences, too. The Western states - hypothetical early adopters of the legalization of gay marriage - were relatively slow to sanction interracial marriage. And the Midwest, especially the "prairie populism" states of the Upper Midwest, were early in sanctioning interracial marriage, but are predicted to be slower on the same-sex marriage front. (Of course, Iowa has already become the fourth state to legalize gay marriage - before any Western state - so history may yet repeat itself.)

And, of course, the time scales are radically different: it took nearly 200 years between the first state ban on interracial marriage to be lifted (Pennsylvania, in 1780) and the Supreme Court decision that ended such bans once and for all. And the progress was very fitful. After Pennsylvania, no marriage ban was lifted until 1843; 44 years later, ever Northern Union state other than Indiana had lifted their bans. But then - nothing, literally for generations. The post-Reconstruction period of racist retrenchment, aka Jim Crow, saw a total lack of progress in the states on interracial marriage. It wasn't until the modern Civil Rights era that interracial marriage bans again started to be overturned. And even by the time of the Loving decision, the country was still deeply bifurcated: every single non-Southern or border state had repealed their marriage bans, and every single Southern state still had a ban on the books.

Are there lessons to be drawn here about the future of same-sex marriage? One would seem to be that progressive change is not inexorable; or if it is, it can still be delayed by quite a lot, as the 1887 to 1948 lacuna in repealing marriage bans shows. And, though the generational divide on gay marriage is really stark, according to polls like this one, which found that 41% of people under 45 support same-sex marriage, as opposed to 18% of people over 65, even young people are only split on the issue, so it would seem wrong to view the inexorable spread of marriage equality as a fait accompli.

Nonetheless, I think there are good reasons to think that an outcome in which same-sex marriage becomes broadly accepted within a generation is likely. In particular, that same poll shows 60-35% support for either same-sex marriage or civil unions. That seems to suggest that, despite some lingering apprehension about what some people see as a re-definition of marriage, there is broad support for the principle of equality for gay couples. There's no reason to expect that support to reverse itself. The taboo on gay relationships is on the way out the door, and I can't help but think that it's only a matter of time before the law reflects this reality.

Here, by the way, are the dates when anti-miscegenation laws were repealed, according to Wikipedia.

Pennsylvania - 1780
Massachusetts - 1843
Iowa - 1851
Kansas - 1859
New Mexico - 1866
Washington - 1868
Illinois - 1874
Rhode Island - 1881
Maine - 1883
Michigan - 1883
Ohio - 1887

California - 1948
Oregon - 1951
Montana - 1953
North Dakota - 1955
Colorado - 1957
South Dakota - 1957
Idaho - 1959
Nevada - 1959
Arizona - 1962
Nebraska - 1963
Utah - 1963
Indiana - 1965
Wyoming - 1965
Maryland - 1967

Alabama - June 12, 1967
Arkansas - June 12, 1967
Delaware - June 12, 1967
Florida - June 12, 1967
Georgia - June 12, 1967
Kentucky - June 12, 1967
Louisiana - June 12, 1967
Mississippi - June 12, 1967
Missouri - June 12, 1967
North Carolina - June 12, 1967
Oklahome - June 12, 1967
South Carolina - June 12, 1967
Tennessee - June 12, 1967
Texas - June 12, 1967
Virginia - June 12, 1967
West Virginia - June 12, 1967

Monday, April 20, 2009

Heavy Metal Map of Europe

Internets, I know you've been on tenterhooks wanting to know just what the distribution of heavy metal bands in Europe actually is. Well, concern yoursevles no more, because I, for some reason, have taken upwards of 20 minutes out of my day to make this map.


It's based on the metal band listings at metalmap.org, which a commenter pointed to in the previous thread. Scandinavia, as you can see, is more than well-represented. I am unsurprised by this, but also unsure why I am unsurprised. Here, in no rational order, are the number of heavy metal bands listed at that site for the coutries of Europe:

Iceland - 19
Ireland - 26
UK - 64
Norway - 311
Sweden - 517
Finland - 99
Estonia - 103
Latvia - 18
Lithuania - 46
Poland - 265
Russia - 82
Belarus - 46
Ukraine - 28
Moldova - 3
Romania - 176
Bulgaria - 36
Greece - 23
Macedonia - 1
Albania - 4
Serbia - 32
Montenegro - 0
Bosnia - 16
Croatia - 28
Slovenia - 21
Hungary - 74
Slovakia - 79
Czech Republic - 240
Austria - 99
Switzerland - 111
Germany - 298
Italy - 279
Denmark - 40
Netherlands - 258
Belgium - 149
Luxembourg - 11
France - 195
Spain - 157
Portugal - 86
Malta - 3

The site further breaks down metal bands into black metal, black/death, crust, crust/grind, death, death/black metal, death/doom, death/grind, doom metal, experimental, gore/grind, grindcore, grind/noise, hc/grind, industrial, jazz/grind, melodic black metal, melodic death metal, noise, noise/grind, sympho black metal, sympho doom metal, and thrash/death subcategories.

If, like me, you obviously have too much time on your hands, you can spend a couple minutes reading through the names of the bands. It's an odd sort of meditation, like walking through a Hieronymus Bosch painting.


If you're into that sort of thing.

Sunday, April 19, 2009

Heavy Metal Map of the World

Via Map of the Week, the Middlebury College radio station, of all places, made a heavy metal cartogram.


Country size corresponds to number of band listings in the Encyclopaedia Metallum. It's a little hard to tell which European countries are which, but there at least seems to be something of a skew towards the Teutonic.

Friday, April 10, 2009

The Geography of Buzz

The Spatial Information Design Lab at Columbia University has been documenting the geography of buzz.


Those are maps of Manhattan. According to SIDL (as I assume they call themselves):
In the summer of 2008, the Spatial Information Design Lab set out to analyze the unique spatial and social dynamics that are created by the arts and entertainment industries in New York City and Los Angeles. Working with Elizabeth Currid from the University of Southern California, the lab used a database of arts and entertainment event photography by Getty Images as a proxy for social interaction in geographical space. Because photographs taken by Getty are tagged with location information, they are transformed into data with an unexpectedly powerful spatial component.

The results of the research showed that both Los Angeles and New York have unique “event geographies”, or locations of interest to Getty photographers that reappear at a statistically high [sic] rate than the rest of the city. While each separate arts industry showed some tendencies toward specific geographic locations the events geographies of all the industries are largely held in very similar locations, suggesting that event geographies appear to be closely linked to iconic symbols in both cities.
Now this is all very interesting, but something about this project strikes me as fundamentally tautological: they are determining which places are culturally significant in terms of which places are most frequently photographed. But a place is only going to be frequently photographed if it is deemed culturally significant. So they're determining what places should be deemed culturally significant by determining which places are already deemed culturally significant.

Don't get me wrong - there's value in that. It's interesting to see a map of what are essentially our culture's collective perception of a place; such documentation is a good way for us to become self-aware about those perceptions. But I don't think we should expect to gain any great new insights from these methods. (There's a lot of theatre activity near Broadway? You don't say.) After all, if there are biases in what we (or, more specifically, Getty photographers) deem culturally significant, then these maps will display the same biases.

Like, look at this, from a NY Times article on the project:
That the buzzy locales weren’t associated with the artistic underground was a quirk of the data set — there were not enough events in Brooklyn to be statistically significant — and of timing. “If we took a snapshot two years from now, the Lower East Side would become a much larger place in how we understand New York,” Ms. Currid said.
That doesn't sound like a "quirk of the data set" to me. That just sounds like a method that is keyed to pick up on the most prominent cultural events, which by definition won't be underground or cutting-edge, and which will therefore be confirming of conventional wisdom.

Still, it's cool to be able to quantify the seemingly unquantifiable. I always say: if the rich texture and ambiguity of emotional experience can't be reduced to the barren certainties of mathematics, then what good are feelings anyway?

No, I kid. To quote a man named Junior, "Saying that the quantification of the seemingly unquantifiable aspects of human experience* undermines 'enjoyment' and the 'human factor' is like creationists saying that evolution takes away the 'wonder' and 'mystery' of the universe. It doesn't. It makes it awesomer."

Indeed.

Bonus map of LA (more here):


*Instead of 'the quantification of the seemingly unquantifiable aspects of human experience,' Junior actually said 'VORP.' But the point stands.

Monday, April 6, 2009

The Baseball Map of America

The long darkness known as the baseball off-season is finally over. In cartographic celebration of this sporting Eostre, here is the map of the countries of baseball in North America:


Thirty teams, thirty countries, one evil empire.

Friday, March 27, 2009

The Sitcom Map of America

Dan Meth has made a sitcom map of the United States.


Naturally, New York City requires its own map.


Mr. Meth makes a cogent observation: "The untapped Williamsburg Hipster sitcom setting is plain to see."

Indeed. By the way, I'm surpised at the proportion of Midwestern to Southern sitcoms, especially given that the South is an inherently funnier region of the country.

UPDATE: Ha! Meth also maps the stunning diversity of first-floor layouts in sitcom houses.

Friday, March 13, 2009

The Disappearance of the English Countryside

A study from the Campaign to Protect Rural England maps the effect of urbanization and development on the english countryside.


From the summary of the report:
We have developed a method of mapping areas of intrusion in England. These are areas disturbed by the presence of noise and visual intrusion from major infrastructure such as motorways and A roads, urban areas and airports. The resulting maps show the extent of intrusion in the early 1960s, early 1990s and 2007.
The report also has extensive data tables so you can see, for instance, that Oxfordshire County has gone from 75.45% undisturbed in the 1960s, to 54.63% in the early 1990s, to 41.45% today. It has such figures for all counties in England.

The maps are interesting in their own rights; but I'm also intrigued by the difference in the premise of this study from what you might see coming from a conservationist society in the U.S. In the States, you don't see much of this sort of concern with the aesthetic corruption of the countryside; what you do see is a concern for keeping areas in a state of uncorrupted wilderness (however that is defined). The American approach may be sentimental, in some ways, but it's not particularly aestheticist. I'm sure this has to do with the fact that the U.S. has an enormous amount of rural land, and it's not under threat of being consumed whole by a nation-swallowing urban conglomeration; and then, too, there's the fact that England doesn't really have any wilderness left to preserve. But I wonder if there's also a different approach to nature going on here: Americans see nature as an Eden to be preserved, or exploited for its resources; Brits see it as a garden to be managed. But this is just an idle hypothesis - anyone have any thoughts on this (poossible) cultural difference?

Tuesday, March 3, 2009

The Food Nations of North America

From Renewing America's Food Traditions, a coalition of organizations dedicated to promoting the diverse foods and food traditions of North America, comes this map of the "food nations" of the continent:


According to RAFT, this map identifies what it calls "totem foods" which are emblematic not only of a regional cuisine, but of an entire culture:
These totem foods are more than just important commodities--community feasts, household rituals, song, stories and the nutritional well-being of residents have revolved around these foods for centuries.
It's fair to say, in other words, that this map is not just a map of North American food commodities, but a full-blown cultural map of the continent.

It's not hard to intuit that there's something to this depiction of cultural geography. Indeed, this geographical partition is similar in many of its particulars to others made in the areas of cultural and political geography, including some I've discussed here. Chile Pepper Nation corresponds pretty closely to the areas of the US Southwest that used to be part of Mexico (and the part of northwestern Mexico that still is), and that is heavily influenced by Mexican and certain Native American cultures. Clambake Nation is the Yankee portion of the Bos-NY-Wash mega-region, plus the coastal areas of the Atlantic that correspond to the Eastern portion of Robert David's Upper Coasts region, while the western portion of Upper Coasts, the region anchored by the Cascasdia mega-region goes here by the name of Salmon Nation. Corn Bread and BBQ Nation is otherwise known as the Greater South, less Gator Nation, which is just another way of describing the Gulf Coast Mega-region. And Moose Nation - well, that's just Canada minus the parts that have people.

As the RAFT folks write in the introduction to their book on America's food traditions, more than 400 years after the first white people started mucking about on the continent:
two-thirds of the distinctive seeds and breeds which then fed America have vanished. One in fifteen wild, edible plant and animal species on this continent has diminished to the degree that it is now considered at risk. These declines in diversity bring losses in traditional ecological and culinary knowledge as well. Consequently, we have suffered declines in the food rituals which otherwise link communities to place and cultural heritage.
It's not gone unnoticed that there has been some degree of homogenization in ways we eat. One big reason for this has been industrialized agriculture and cheap transportation costs: just look at the stickers on your produce to see what kind of epic vegetable diaspora your daily diet represents. Normally I'd lament the cultural homogenization, but I've just been reading some Jim Kunstler, whose dystopian rants can't help but give one the sense that, while a return to localism in the food supply is likely just around the corner, it will only be because we are going to have far greater problems to worry about: namely, the end of cheap transportation and general economic collapse. (The pinch of salt with which one is inclined to take Kunstler would be a good bit larger if not for the fact that his predictions of doom have been spot on for the past year or so.)

But I digress. The RAFT map is interesting and their goals noble. They go into far greater detail in their book, which you can download as a pdf file free of charge at this site. In those pages they detail the ten most endangered traditional foods: Chapalote corn, Chiltepin pepper, Eulachon Smelt, Gulf Coast sheep, Java chicken (which is, yes, actually from Asia originally, but never mind), Marshall strawberry, Native American sunflowers, Pineywoods cattle, the Seminole pumpkin, and White Abalone. (They also list the top ten success stories - traditional foods that have made a comeback - including American alligator, Louisiana Creole cream cheese, and Iriquois white corn.)

The book also has a comprehensive index of endangered traditional foods; especially given the price tag, it's really an essential reference for anyone in North America who cares about food, culture, and the preservation of traditional knowledge.

Thursday, February 26, 2009

Endangered Languages

UNESCO has just come out with a fascinating new resource: an Interactive Atlas of the World's Languages in Danger.


The atlas lists some 2,500 languages worldwide, including 230 that have gone extinct since 1950. Languages are rated on a scale from unsafe to extinct, according to these criteria:

Safe: language is spoken by all generations; intergenerational transmission is uninterrupted
Unsafe: most children speak the language, but it may be restricted to certain domains (e.g., home)
Definitely Endangered: children no longer learn the language as mother tongue in the home
Severaly Endangered: language is spoken by grandparents and older generations; while the parent generation may understand it, they do not speak it to children or among themselves
Critically Endangered: the youngest speakers are grandparents and older, and they speak the language partially and infrequently
Extinct: there are no speakers left

As you might expect, the coutries with the most endangered languages tend to be those with the greatest linguistic diversity. They also tend to be the areally largest countries, especially those with diverse indigenous populations that are under pressure from homogenizing cultural forces. India has the most endangered languages, with 196, followed closely by the United States with 191, and Brazil with 190. Indonesia, Mexico, China, Russia, and Australia all also have more than 100, and linguistic powerhouse Papua New Guinea has 98.

But what is striking to me is just how widespread the distribution of endangered languages is. There are endangered languages is places I would never have expected them - Western Europe, for instance, has dozens of endangered languages, from Griko to Walloon to Sorbian; Italy alone has 31.

Languages are always coming and going, of course, and probably will continue to do so as long as there are people. But due to the forces of urbanization and globalization, more have been going than coming lately. Since Columbus showed up in the New World, for instance, 115 languages have died out in what is now the United States out of an original 280 - most recently Eyak, a native Alaskan language which Marie Smith Jones took with her to the grave in 2008.

As with the disappearance of a species, there's something heartbreaking about the loss of a language. It represents an irreversible diminution of the diversity and fecundity of the human cultural legacy; languages are the conduits for the traditions and wisdom which are collectively held by a people, and when a language blinks out from the world, those things die along with it. The site captures something of this poignancy, and the challenge to the identities of endangered language speakers, with a poem by Alitet Nemtushkin, an Evenki poet:
If I forget my native speech,
And the songs that my people sing
What use are my eyes and ears?
What use is my mouth?

If I forget the smell of the earth
And do not serve it well
What use are my hands?
Why am I living in the world?

How can I believe the foolish idea
That my language is weak and poor
If my mother’s last words
Were in Evenki?