A Gantt chart is a visual timeline of a project that shows tasks and schedules. It helps track progress and manage deadlines, and you can create one in Google Sheets and add it to Google Docs.
Different Ways to Create a Gantt Chart in Google Docs
Remember, Gantt charts help you visualize project timelines and progress. Let's get into creating a Gantt chart in Google Docs.
- Method 1: Inserting from an Existing Google Sheets Gantt Chart
- Method 2: Using the Stacked Bar Chart
Steps to Create a Gantt Chart in Google Docs Using Google Sheets
To make a Gantt Chart from Google Sheets, you need to have a chart prepared with your data in Google Sheets. To insert that existing Google Sheet chart into your Google Docs, follow the steps provided below for your reference.
Step 1: Open a New Google Doc
Start by opening a new document in your Google Drive.
Step 2: Go to Insert Tab, Click on Chart and Select From Sheets
Click on Insert > Chart> From Sheets. Choose the spreadsheet containing your Gantt chart data.

Step 3: Preview and Customize Your Chart
Adjust the size, rotation, text wrapping, and other settings to make it visually appealing. Use the below tools to customize your chart:
- Size & Rotation
- Text Wrapping
- Position
- Recolor
- Transparency, Brightness, and Contrast under Adjustments

Step 4: Bonus Tip
Explore other tools like project timelines and mind mapping within Google Docs!
Steps to Create a Gantt Chart Using the Stacked Bar Chart
Discover how to create a Gantt chart using the Stacked Bar Chart feature in Google Sheets for a customized timeline.
Step 1: Open a New Google Doc
Create a new document in your Google Drive.
Step 2: Go to the Insert Tab, Click on Chart and Select Bar Chart
Click on Insert > Chart > Bar. Select Edit in Sheets or Open Source.
.webp)
Step 3: Select Open Source and Set Up Your Data
Input task names, start dates, and end dates in Google Sheets.

Step 4: Customize the Chart
Adjust colors, fonts, and axis titles.
Step 5: Update Your Doc
Click UPDATE on the image to apply changes made in Google Sheets.
Steps to Save Basic Gantt Chart as a Template in Google Docs
Save your customized Gantt chart as a template in Google Docs to streamline future project planning and management.
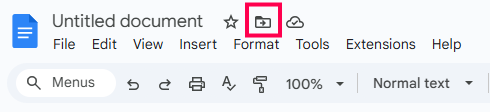
Step 1: Save Your Gantt Chart as a Template
Click on the folder icon next to your document’s title, select New folder, name the folder, and click the check mark to save.
Step 2: Use the Template for Future Projects
By saving your Gantt chart as a template, you can easily reuse it for future projects, saving you time and effort.