Conversion of block diagrams into a signal flow representation simplifies analysis of control systems. Graphical representation shows relationships between system variables using nodes and directed branches. Such representation helps engineers study signal paths and system behaviour more clearly.
- Each system variable, such as input, intermediate signal, and output, is represented by a node.
- Functional relationships between variables are represented by directed branches with gains.
- Take-off points appear as multiple branches starting from the same node.
- Summing operations appear as nodes receiving several incoming branches with positive or negative gains.
Important Terms in Signal Flow Graph
- Node: represents a system variable whose value equals the sum of all incoming signals. Incoming branches determine the value at the node, while outgoing signals do not influence the node value.
- Branch: A branch is a directed line that connects two nodes and represents the path of signal flow between them.
- Transmittance: Gain between two nodes, also known as branch gain.
- Input or source node: Node having only outgoing branches.
- Output or sink node: Node having only incoming branches.
- Chain or mixed node: A node having both incoming and outgoing branches.
- Path: Traversal from one node to another in the direction of signal flow without passing through any node more than once.
- Forward Path: Path connecting the input node to the output node.
- Closed loop: A loop that begins from a node and returns to the same node.
- Self-loop: A loop that begins and ends at the same node with a single branch.
- Path gain: Product of all branch gains along a path.
- Loop gain: Product of branch gains along a closed loop.
Construction of Signal Flow Graph from Linear Equation
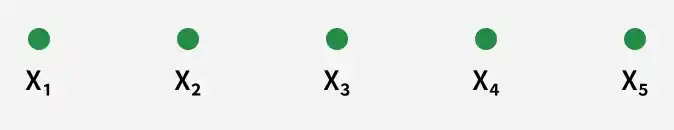
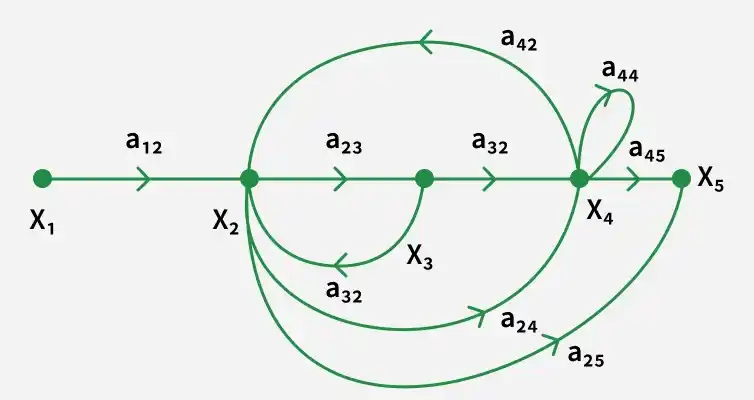
Let us consider a system which is described by a set of linear equations
Where the input node is x1 and output node is x5
Now constructing the SFG
Step 1: First placing the nodes.
Step 2: Graph from 1st Equation
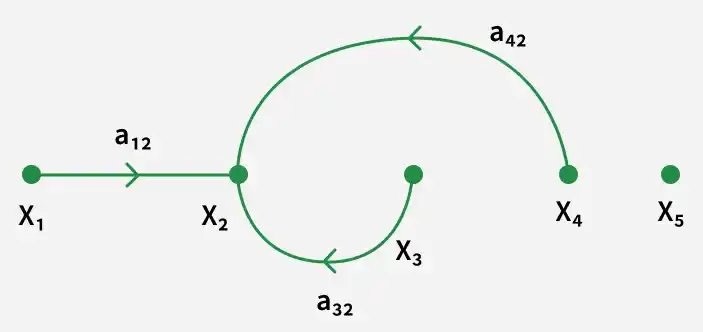
Step 3: Graph from 1st and 2nd equation
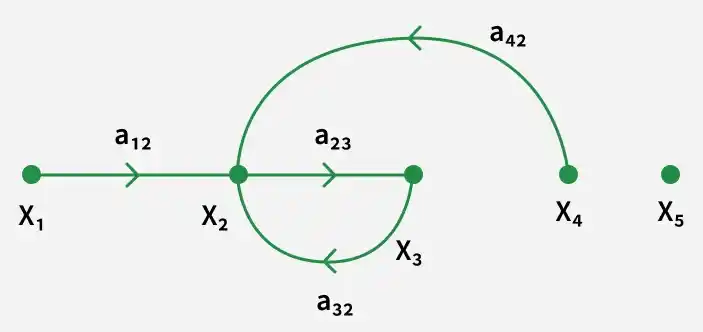
Step 4: Graph from 1st, 2nd and 3rd equation
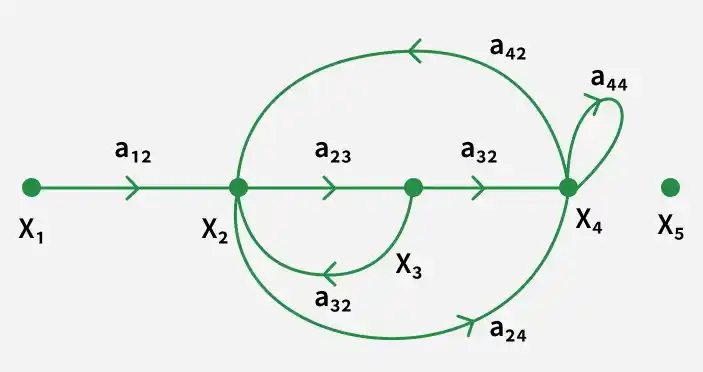
Step 5: Combing all the four equations we get the final signal flow graph
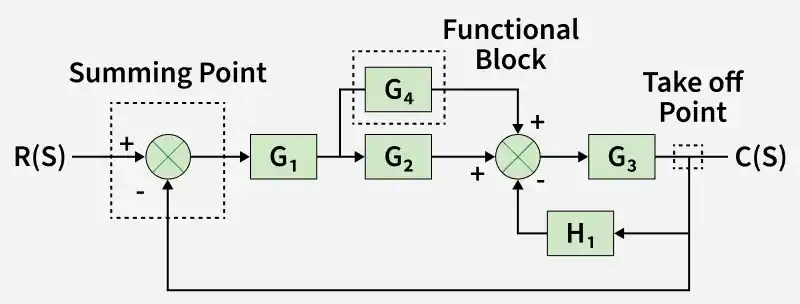
Block Diagram
A system consists of number of components. The function of each component is represented by a block. All the blocks are interconnected by the lines with arrows indicating the flow of signal from output of onw block to another. These block diagram gives the idea of the system and the interrelation of various components of the system.
Different parts of Block Diagram
- Functional Block: This symbol represents the transfer function G(s) of a system.
- Summing Point: This is the point where different output signal from previous block or different signals of the system are added to form a single signal
- Take off point: It is tapping point in the system where the desired signal is tapped off to be utilized elsewhere in the diagram.
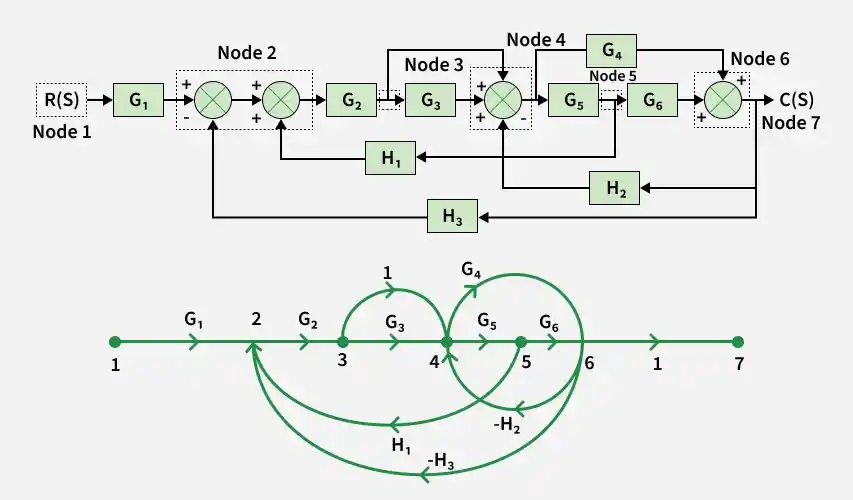
Steps to Draw Signal Flow Graph from Block Diagram
- Replace the input and output signal by nodes.
- Replace all the summing points by nodes.
- Replace all taking off points by nodes.
- A branch connecting a summing point and a take-off point can be merged and represented using a single node.
- Multiple take-off points from the same signal can be combined and represented by one node.
- Two summing points connected by a link with unity gain can be merged and replaced by a single node.
Mason's Gain Formula
Mason's gain formula is used to find the overall transmittance or gain of the system from signal flow graph.
Where,
- Pk is the forward path gain of kth path from a specified input node to an output node
\Delta_k is the path factor associated with the concerned path and involves all closed loops in the graph which are isolated from the forward path under consideration.\Delta = 1 - [sum of all individual loop transmittance] + [sum of loop transmittance products of all possible pairs of non-touching loops] - [sum of loop transmittance products of all possible triplets of non-touching loops] + .......
Solved Example
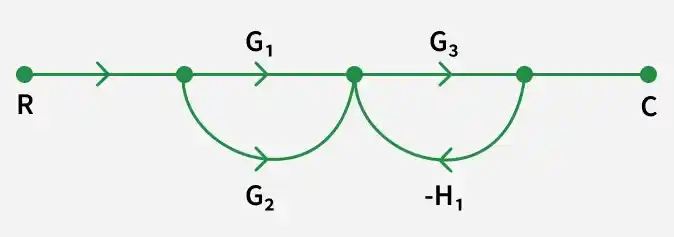
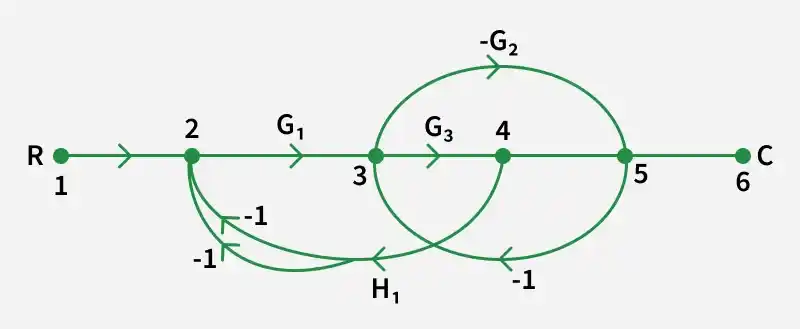
Convert the block diagram into signal flow graph and find the overall transfer function
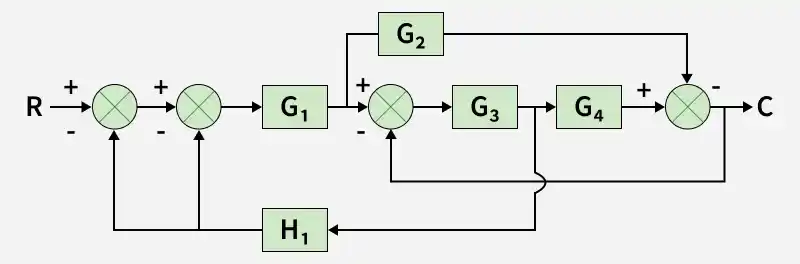
The signal flow diagram of the given block diagram is
The forward paths are
The loop gains are
As we can see that all loops are touching path
using mason's gain formula we get,
Applications
- Provides a clear representation of signal propagation within a system.
- Defines different paths in a system, which helps in analysing overall system behaviour.
- Supports control system design and assists in analysing and implementing feedback loops.
- Helps in developing mathematical models for control systems.
Advantages
- Provides a clear and easy-to-understand graphical representation of a system, which helps in identifying different system components.
- Reduces overall system complexity and allows step-by-step analysis of different components.
- Conversion of a block diagram into a graphical form creates a simpler representation and makes path identification easier.
Disadvantages
- Application remains limited to linear time-invariant systems and cannot represent non-linear systems.
- Large numbers of components and loops may increase the chance of manual errors during analysis.
- Representation mainly shows signal flow, while some important system parameters may not appear clearly.
- Analysis may become difficult for very complex and large control systems.