Bokeh is a powerful Python library that enables the creation of interactive and visually appealing plots. One of its key features is the ability to add tooltips, which provide additional information when a user hovers over a plot element. However, by default, Bokeh may display numerical data as floats, which can be undesirable if you want to show integer values. This article will guide you through the process of configuring Bokeh tooltips to display integers instead of floats.
Table of Content
Understanding Bokeh Tooltips
Tooltips in Bokeh are configured using the HoverTool, which allows you to display additional information about a plot's data points. The tooltips can be customized to show various data attributes, and you can format these attributes to display in a specific way.
Basic Tooltip Configuration
To add a tooltip to a Bokeh plot, you need to:
- Import Necessary Modules: Import
HoverToolfrombokeh.modelsand other relevant modules from Bokeh. - Create a Plot: Use
figure()to create a plot. - Add Glyphs: Add glyphs (e.g., circles, lines) to the plot.
- Configure Tooltips: Create a
HoverToolobject and specify the tooltips. - Add HoverTool to Plot: Use
add_tools()to add theHoverToolto the plot.
Displaying Integers in Tooltips with Bokeh
By default, Bokeh may display numerical values as floats, even if they are integers. To ensure that integers are displayed without decimal places, you need to format the tooltip values appropriately.
Step 1: Install and Import Bokeh
First, ensure you have Bokeh installed. If not, you can install it using pip:
pip install bokeh
Next, import the necessary modules:
from bokeh.plotting import figure, show
from bokeh.io import output_notebook
from bokeh.models import HoverTool

# Display plots inline in Jupyter Notebook
output_notebook()
Step 2: Create a Sample Plot
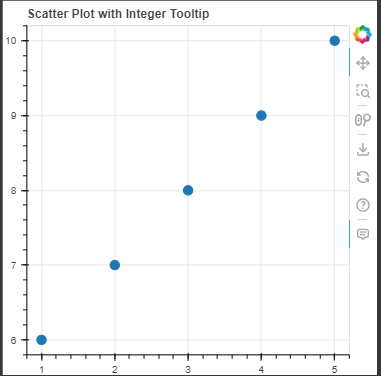
Let’s create a simple scatter plot to demonstrate how to format tooltip values as integers:
# Sample data
x = [1, 2, 3, 4, 5]
y = [6, 7, 8, 9, 10]

# Create a new plot
p = figure(width=400, height=400, title="Scatter Plot with Integer Tooltip")

# Add a scatter renderer
p.scatter(x=x, y=y, size=10)

# Show the plot with default tooltip (float)
show(p)
Output:

Step 3: Configure Hover Tool to Show Integers
To format the hover tooltips to show integers instead of floats, you need to specify a custom format for the tooltip. This is done by creating a HoverTool object and configuring it with the desired format.
# Create a new plot
p = figure(width=400, height=400, title="Scatter Plot with Integer Tooltip")

# Add a scatter renderer
p.scatter(x=x, y=y, size=10)

# Define the hover tool with integer formatting
hover = HoverTool()
hover.tooltips = [("X", "@x{0}"), ("Y", "@y{0}")]

# Add the hover tool to the plot
p.add_tools(hover)

# Show the plot with integer tooltips
show(p)
Output:
Explanation:
- HoverTool: This Bokeh model allows you to customize the tooltips that appear when hovering over data points.
- hover.tooltips: Defines the content and format of the tooltip. The format {0} specifies that values should be displayed as integers.
Common Issues and Troubleshooting
1. Floats Displayed Instead of Integers
If you still see floats instead of integers, ensure that:
- The data source contains integer values.
- The format specifier
{0}is correctly applied in the tooltip configuration.
2. Tooltip Not Displaying
If the tooltip is not displaying, check:
- The
HoverToolis added to the plot usingadd_tools(). - The data source and field names in the tooltips match those in the
ColumnDataSource
Conclusion
Customizing tooltips in Bokeh to display integers instead of floats enhances the readability of your plots. By using the HoverTool model and formatting tooltips, you can ensure that numeric values are presented clearly and appropriately for your audience.