A normality test is a statistical procedure used to assess whether a dataset follows a normal distribution. It evaluates the shape of the data’s distribution and compares it to the expected shape of a normal distribution. If the result shows significant deviation, it may suggest that the data is not normal, affecting the choice of statistical methods used later.
How is the normal distribution tested?
To determine whether a dataset follows a normal distribution, several statistical tests are used. The three most common and reliable methods are:
1. Shapiro-Wilk Test
- Purpose: Specifically developed to test normality.
- Best Suited For: Small to medium-sized datasets (typically less than 2000 samples).
- How It Works: Compares the order statistics of the data with those expected from a normal distribution.
- p-value > 0.05: Data may be normally distributed (fail to reject null hypothesis).
- p-value < 0.05: Data significantly deviates from normal distribution (reject null hypothesis).
2. Kolmogorov-Smirnov (K-S) Test
- Purpose: Kolmogorov-Smirnov (K-S) Test Tests if a sample comes from a specific distribution (e.g., normal).
- Best Suited For: Larger datasets.
- How It Works: Compares the empirical distribution function of the sample with the cumulative distribution function of the normal distribution.
- p-value > 0.05: No significant difference → data could be normally distributed.
- p-value < 0.05: Significant difference → data not normally distributed.
- May be too sensitive with very large samples, detecting minor deviations as significant.
3. Anderson-Darling Test
- Purpose: A more refined version of the K-S test, with added focus on the tails of the distribution.
- Best Suited For: All dataset sizes; especially useful when tail behavior matters.
- How It Works: Measures how well the data follow a normal distribution, giving more weight to the tails.
- Compares the test statistic to critical values. If it exceeds the critical value, normality is rejected.
- Does not give a direct p-value but is considered more powerful in detecting deviations in the tails.
Importance of Normality Testing
Normality testing plays an important role in ensuring that the statistical methods we use give accurate and trustworthy results. Many traditional statistical techniques are based on the assumption that the data follows a normal distribution. If this assumption is not met, the results from these methods can be misleading or incorrect.
By testing for normality, we can:
- Confirm whether we can safely use certain statistical tools or models.
- Choose the most suitable method for analyzing the data.
- Improve the reliability of conclusions drawn from the data.
- Avoid making wrong decisions based on incorrect analysis.
In short, checking for normality helps us work with data more effectively and ensures the results are valid and meaningful.
Real-Life Example
Suppose you're analyzing the scores of 1,000 students on a standardized test where the average score is 0 (after normalization) and most students score near the average. A few students perform exceptionally well or poorly, but they are fewer in number.
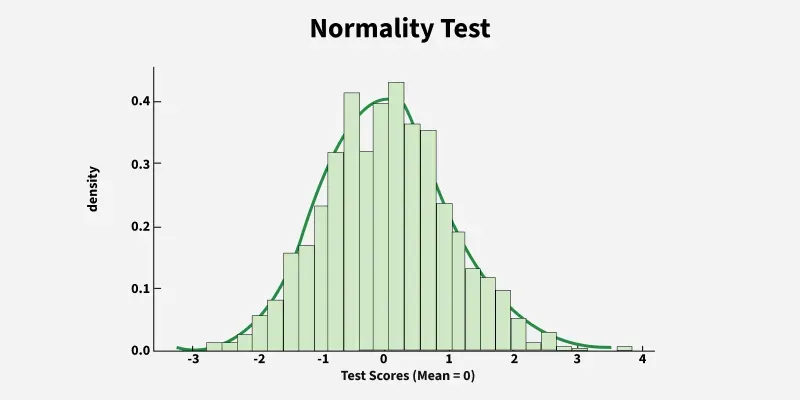
The graph above illustrates a normality test conducted on standardized test scores of 1,000 students. The objective was to determine whether the distribution of scores follows a normal distribution, which is essential for many statistical analyses.
In this case, the Shapiro-Wilk test was used, a powerful method suitable for sample sizes less than 2,000 to assess whether the data comes from a normally distributed population. The test evaluates the null hypothesis that the data is normally distributed. A p-value greater than 0.05 would suggest that we do not reject the null hypothesis, indicating the data is approximately normal.
Understanding the Graph
- X-axis: Represents the range of test scores (mean = 0 after normalization).
- Y-axis: Shows the density, how frequently those scores occur.
- Bell Curve Shape: Indicates a normal distribution, symmetrical and centered around the mean.
- KDE Curve: The smooth green line is the Kernel Density Estimation, giving an estimate of the probability density function for the dataset.
Key Features
- Symmetry: The graph is symmetric around the center (mean = 0).
- Peak at the Mean: Most scores cluster around the mean, which is the highest point of the curve.
- Tapering Tails: The frequency of extreme scores decreases as we move further from the mean, forming the classic "bell" shape.