Data Analytics is the process of examining raw data to uncover patterns, draw meaningful insights and support better decision making. It helps individuals and businesses understand past performance, monitor current trends and predict future outcomes. Features of Data Analytics are:
- Helps identify trends, patterns and anomalies in data to make informed decisions.
- Uses historical and current data to forecast future outcomes and opportunities.
- Involves building systems and tools to efficiently handle, process and analyze large volumes of data.
Importance & Usage of Data Analytics
Data analytics is used in many fields like banking, farming, shopping, government and more. It helps in many ways:
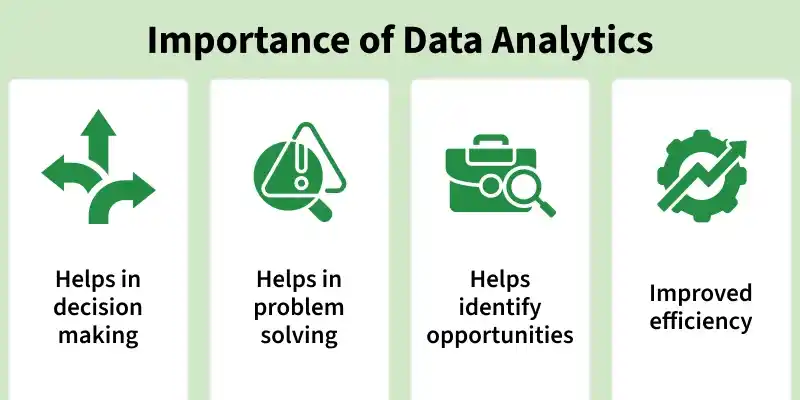
- Decision Making: It gives clear facts and patterns from data which help people make smarter choices.
- Problem Solving: It points out what's going wrong and why making it easier to fix problems.
- Identify Opportunities: It shows trends and new chances for growth that might not be obvious.
- Improved Efficiency: It helps reduce waste, saves time and makes work smoother by finding better ways to do things.
Process of Data Analytics
Data analysts, data scientists and data engineers together create data pipelines which help to set up the model and do further analysis. Data Analytics can be done in the following steps which are mentioned below:
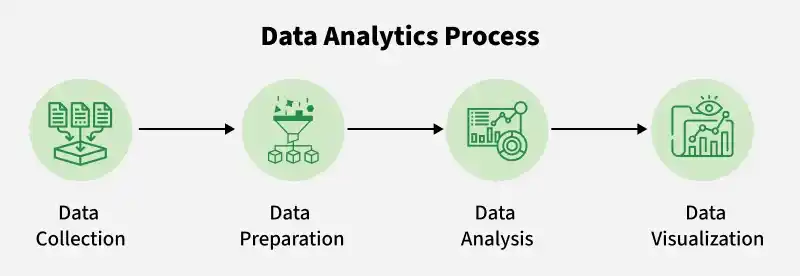
- Data Collection: Gathering raw data from sources like websites, apps, surveys, or machines and combining or selecting relevant parts.
- Data Cleansing: Cleaning data by fixing errors, handling missing values, and removing duplicates for accuracy.
- Data Analysis and Interpretation: Using tools like Python, R, SQL, or Excel to find patterns and extract meaningful insights.
- Data Visualization: Presenting data through charts and graphs to easily understand trends and insights.
Types of Data Analytics
There are different types of data analysis in which raw data is converted into valuable insights. Some of the types of data analysis are mentioned below:
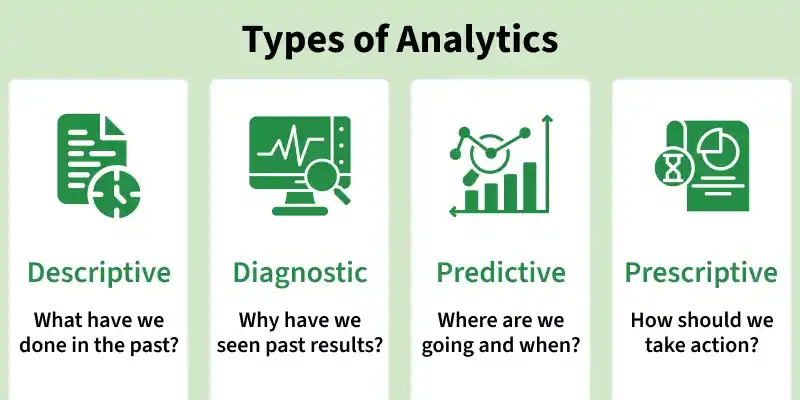
- Descriptive Data Analytics : Helps to summarize and understand past data. Companies use it to compare results, find strengths and weaknesses and spot any unusual patterns.
- Diagnostic Data Analytics: Looks at why something happened in the past. It uses tools like correlation, regression or comparison to find the cause of a problem. This helps companies understand the reason behind a drop in sales or a sudden change in performance.
- Predictive Data Analytics: Used to guess what might happen in the future. It looks at current and past data to find patterns and make forecasts. Businesses use it to predict things like customer behavior, future sales or possible risks.
- Prescriptive Data Analytics: Helps to choose the best action or solution. It looks at different options and suggests what should be done next. Companies use it for things like loan approval, pricing decisions and managing machines or schedules.
Methods of Data Analytics
1. Qualitative Data Analytics
Qualitative data analysis doesn’t use statistics and derives data from the words, pictures and symbols. Some common qualitative methods are:
- Narrative Analytics is used for working with data acquired from diaries, interviews and so on.
- Content Analytics is used for Analytics of verbal data and behaviour.
- Grounded theory is used to explain a given event by studying data systematically and developing a theory based on observed patterns.
2. Quantitative Data Analysis
Quantitative data Analytics is used to collect data and then process it into the numerical data. Some of the quantitative methods are mentioned below:
- Hypothesis testing assesses the given hypothesis of the data set.
- Sample size determination is the method of taking a small sample from a large group of people and then analysing it.
- Average or mean of a subject is dividing the sum total numbers in the list by the number of items present in that list.
Skills Required for Data Analytics
- Some of the common programming languages which are used are R and Python.
- For databases Structured Query Language (SQL) is a programming language used.
- Machine Learning is used in data analysis.
- In order to better analyse and interpret probability and statistics are used.
- For collecting and organising data, Data Management is used in data analysis.
- To use charts and graphs Data visualisation is used.