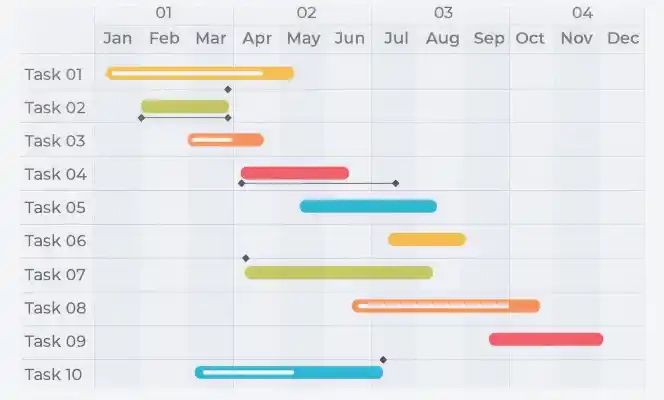
A Gantt Chart is a visual project management tool that represents tasks along a timeline using horizontal bars.
Each bar illustrates:
- Task duration
- Start and end dates
- Task ownership
- Progress status
Purpose of a Gantt Chart
The primary purpose of a Gantt Chart is to simplify project planning and tracking by organizing tasks on a timeline.
It helps to:
- Break down projects into manageable tasks
- Identify task dependencies and sequences
- Allocate resources effectively
- Track progress against planned timelines
- Communicate project status clearly with stakeholders
- Ensure accountability across teams
Key Components of a Gantt Chart
Understanding the core elements of a Gantt Chart is essential for using it effectively:
- Task List: A breakdown of all activities required to complete the project
- Timeline: The overall project duration divided into units (days/weeks/months)
- Bars: Visual representation of each task’s duration
- Milestones: Key checkpoints or significant events
- Dependencies: Relationships between tasks (e.g., one task must finish before another starts)
- Progress Indicators: Status of task completion
- Resources Assigned: Individuals or teams responsible for tasks
Features of Gantt Charts
- Effective Project Visualization: Provides a high-level overview of the entire project timeline, making planning and tracking easier.
- Easy to Use: Most tools offer drag-and-drop functionality, allowing quick updates to timelines and tasks.
- Seamless Integration: Can be integrated with existing project management tools and workflows.
- Ideal for Complex Projects: Handles multiple tasks, subtasks, and dependencies efficiently.
- Insightful Decision-Making: Highlights critical paths and potential bottlenecks, helping managers prioritize tasks.
Steps to Create a Gantt Chart
Creating a Gantt Chart involves a structured approach:
Step 1: List All Tasks
- Identify all activities required to complete the project (e.g., development, testing, deployment).
Step 2: Define Task Sequence
- Arrange tasks in chronological order and identify dependencies.
Step 3: Estimate Task Duration
- Determine how long each task will take based on scope and complexity.
Step 4: Assign Dates
- Set realistic start and end dates for each task.
Step 5: Assign Resources
- Allocate team members or resources to each task.
Step 6: Track and Update
- Continuously monitor progress and update the chart as the project evolves.
Users of Gantt Charts
Gantt Charts are widely used across industries by:
- Project Managers
- Team Leaders
- Stakeholders
Common industries include:
- Construction
- Software Development
- Manufacturing
- Event Planning
- Consulting
- Engineering
- Marketing
- Human Resources
Advantages of Gantt Chart
Here are the following advantages of Gantt Chart:
- Clear Task Visibility: Easily identify tasks and their relationships
- Improved Resource Management: Track resource allocation and utilization
- Better Scheduling: Manage task sequences effectively
- Enhanced Collaboration: Keeps teams aligned and informed
- Progress Tracking: Compare planned vs actual performance
When to use the Gantt Chart
A Gantt Chart is most effective when you need to:
- Manage complex projects with multiple dependencies
- Focus on timeline-driven deliverables
- Coordinate tasks across teams
- Visualize project progress clearly
- Plan structured workflows
Gantt Charts in Project Management Methodologies
1. Gantt Charts in Waterfall
In the Waterfall approach, projects are executed in sequential phases. Gantt Charts help:
- Define task order
- Visualize dependencies
- Track progress step-by-step
2. Gantt Charts in Agile
Although Agile focuses on short sprints, Gantt Charts can still be useful for:
- High-level project roadmaps
- Long-term planning
- Visualizing overall project scope
Real-World Use Cases of Gantt Charts
Here are a few examples of how Gantt charts can be used:
- Construction Projects: Plan phases like design, construction, and finishing with clear timelines.
- Software Development: Track development stages such as coding, testing, and deployment.
- Event Planning: Coordinate logistics like venue booking, vendors, and promotions.
- Research Projects: Manage activities like data collection, analysis, and reporting.
Related Articles: