Aquileo | Recent changes to visualizationhttps://sourceforge.net/p/mageck/wiki/visualization/2020-04-12T21:33:54.724000ZRecent changes to visualizationAquileo | visualization modified by Wei Li2020-04-12T21:33:54.724000Z2020-04-12T21:33:54.724000ZWei Lihttps://sourceforge.net/u/davidliwei/https://sourceforge.netaa3a92cfd6fa05c39c18933291422ccae27da233<div class="markdown_content"><pre>--- v13
+++ v14
@@ -20,6 +20,8 @@
Users can also modify the "Parameters" section in .Rmd file to adjust the parameters used in the report.
An example of the generated html file (from test command) can be downloaded [here](https://sourceforge.net/projects/mageck/files/example/tim.report.nb.html/download).
+
+An example of the generated html file (from count command) can be downloaded [here](https://sourceforge.net/projects/mageck/files/example/tim_count.count_report.nb.html/download).
Users need to install rmarkdown package as the dependency:
</pre>
</div>Aquileo | visualization modified by Wei Li2020-04-12T21:21:00.915000Z2020-04-12T21:21:00.915000ZWei Lihttps://sourceforge.net/u/davidliwei/https://sourceforge.net148f90146313bed09ba67d1eacd6c7eed8873f42<div class="markdown_content"><pre>--- v12
+++ v13
@@ -6,7 +6,7 @@
**The [MAGeCKFlute](https://www.bioconductor.org/packages/release/bioc/html/MAGeCKFlute.html) package provides a convenient approach to visualze MAGeCK and MAGeCK-VISPR results using R programming language.**
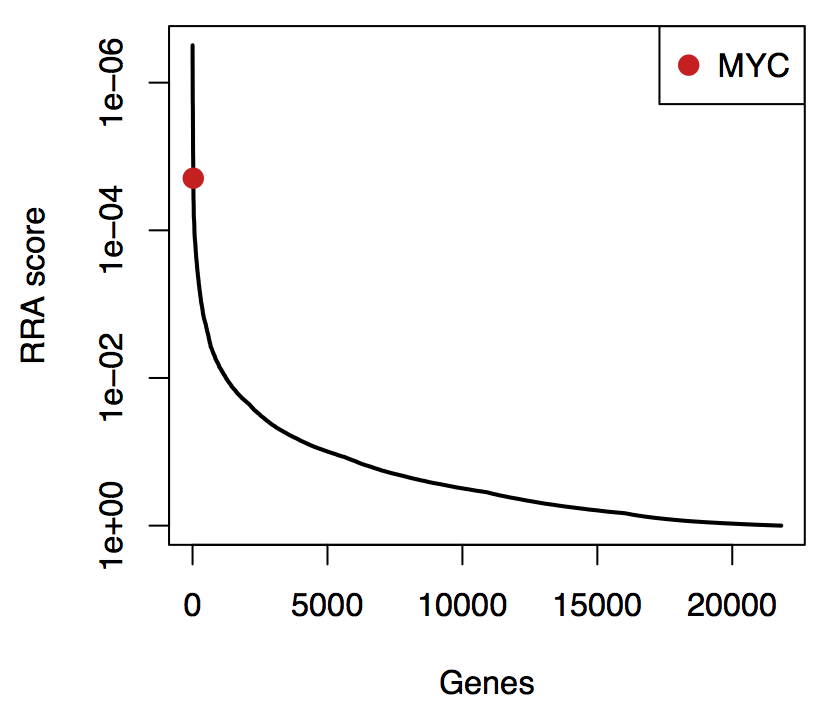
-**Visualization functions are also available within the MAGeCK software.** Since version 0.5, MAGeCK enables a couple of visualization functions. With these features on, MAGeCK helps users better interpret datasets and results, and generates figures and tables that can be directly used in presentations or papers.
+Visualization functions are also available within the MAGeCK software. Since version 0.5, MAGeCK enables a couple of visualization functions. With these features on, MAGeCK helps users better interpret datasets and results, and generates figures and tables that can be directly used in presentations or papers. **The in-house visualization module provides a simple solution for users with limited knowledge in R.**
The Visualization function has additional software dependencies, but they are easy to install in many operating systems. See [installation](https://sourceforge.net/p/mageck/wiki/install) for more details.
</pre>
</div>Aquileo | visualization modified by Wei Li2020-04-12T21:17:14.848000Z2020-04-12T21:17:14.848000ZWei Lihttps://sourceforge.net/u/davidliwei/https://sourceforge.net30bdf4cc10e20e024ade36351c5bfb2400802ea8<div class="markdown_content"><pre>--- v11
+++ v12
@@ -19,6 +19,7 @@
Users can also modify the "Parameters" section in .Rmd file to adjust the parameters used in the report.
+An example of the generated html file (from test command) can be downloaded [here](https://sourceforge.net/projects/mageck/files/example/tim.report.nb.html/download).
Users need to install rmarkdown package as the dependency:
</pre>
</div>Aquileo | visualization modified by Wei Li2020-04-12T20:55:35.289000Z2020-04-12T20:55:35.289000ZWei Lihttps://sourceforge.net/u/davidliwei/https://sourceforge.netb876f6dbfb07cfa1d72c809b1c7546cd779b0985<div class="markdown_content"><pre>--- v10
+++ v11
@@ -3,20 +3,31 @@
# Visualization Functions in MAGeCK #
**We developed a stand-alone visualization tool, VISPR, to visualize CRISPR screening results. See the [paper](http://genomebiology.biomedcentral.com/articles/10.1186/s13059-015-0843-6) and the [VISPR project](https://bitbucket.org/liulab/vispr) for more details.**
+**The [MAGeCKFlute](https://www.bioconductor.org/packages/release/bioc/html/MAGeCKFlute.html) package provides a convenient approach to visualze MAGeCK and MAGeCK-VISPR results using R programming language.**
+
+
**Visualization functions are also available within the MAGeCK software.** Since version 0.5, MAGeCK enables a couple of visualization functions. With these features on, MAGeCK helps users better interpret datasets and results, and generates figures and tables that can be directly used in presentations or papers.
-
-An example of images generated by *plot* command:
-
-<img height="400" rel="nofollow" src="http://a.fsdn.com/con/app/proj/mageck/screenshots/sample1_summary.png" width="400"/>
-
-Here is another example of images generated by *count* command:
-
-<img height="400" rel="nofollow" src="http://a.fsdn.com/con/app/proj/mageck/screenshots/abl_smalllib_stat.png" width="400"/>
The Visualization function has additional software dependencies, but they are easy to install in many operating systems. See [installation](https://sourceforge.net/p/mageck/wiki/install) for more details.
-## The --pdf-report option ##
+## The R markdown option (since 0.5.9.3) ##
+
+Since 0.5.9.3, MAGeCK generates an R markdown file (.Rmd) for count and test options. Users can copy this file (along with all other files generated by MAGeCK) to a computer with [RStudio](https://rstudio.com/) installed, and generate a html based report page.
+
+To generate the report page, simply open the corresponding .Rmd file in RStudio, and press the "Run" --> "Run all" button. A html file will be generated correspondingly.
+
+Users can also modify the "Parameters" section in .Rmd file to adjust the parameters used in the report.
+
+
+Users need to install rmarkdown package as the dependency:
+
+ install.packages("rmarkdown")
+
+
+## The --pdf-report option (before 0.5.9.3) ##
+
+**--pdf-report option will be gradually depreciated after version 0.5.9.3, due to its complicated dependencies on pdflatex.**
MAGeCK will generate PDF files in both *count* and *test* command, by simply adding the *--pdf-report* option. If successful, a <prefix>.countsummary.pdf (for *count* command) or <prefix>_summary.pdf (for *test* command) will be generated.
</prefix></prefix></pre>
</div>Aquileo | visualization modified by Wei Li2016-07-22T15:58:05.323000Z2016-07-22T15:58:05.323000ZWei Lihttps://sourceforge.net/u/davidliwei/https://sourceforge.net892398d8d43ba85d870f79e3bd916bb2a741c07d<div class="markdown_content"><pre>--- v9
+++ v10
@@ -3,7 +3,7 @@
# Visualization Functions in MAGeCK #
**We developed a stand-alone visualization tool, VISPR, to visualize CRISPR screening results. See the [paper](http://genomebiology.biomedcentral.com/articles/10.1186/s13059-015-0843-6) and the [VISPR project](https://bitbucket.org/liulab/vispr) for more details.**
-**Visualization functions are also available with the MAGeCK software.** Since version 0.5, MAGeCK enables a couple of visualization functions. With these features on, MAGeCK helps users better interpret datasets and results, and generates figures and tables that can be directly used in presentations or papers.
+**Visualization functions are also available within the MAGeCK software.** Since version 0.5, MAGeCK enables a couple of visualization functions. With these features on, MAGeCK helps users better interpret datasets and results, and generates figures and tables that can be directly used in presentations or papers.
An example of images generated by *plot* command:
</pre>
</div>Aquileo | visualization modified by Wei Li2016-07-22T15:57:49.166000Z2016-07-22T15:57:49.166000ZWei Lihttps://sourceforge.net/u/davidliwei/https://sourceforge.net6c70ea39c1758d669fa3c042a71ec116d4fc2bf7<div class="markdown_content"><pre>--- v8
+++ v9
@@ -1,9 +1,9 @@
[TOC]
# Visualization Functions in MAGeCK #
-**We developed a stand-alone visualization tool, VISPR, to visualize CRISPR screening results. See the [paper](http://genomebiology.biomedcentral.com/articles/10.1186/s13059-015-0843-6) and the [VISPR project](https://bitbucket.org/liulab/vispr) for more details.
+**We developed a stand-alone visualization tool, VISPR, to visualize CRISPR screening results. See the [paper](http://genomebiology.biomedcentral.com/articles/10.1186/s13059-015-0843-6) and the [VISPR project](https://bitbucket.org/liulab/vispr) for more details.**
-Since version 0.5, MAGeCK enables a couple of visualization functions. With these features on, MAGeCK helps users better interpret datasets and results, and generates figures and tables that can be directly used in presentations or papers.
+**Visualization functions are also available with the MAGeCK software.** Since version 0.5, MAGeCK enables a couple of visualization functions. With these features on, MAGeCK helps users better interpret datasets and results, and generates figures and tables that can be directly used in presentations or papers.
An example of images generated by *plot* command:
</pre>
</div>Aquileo | visualization modified by Wei Li2016-07-22T15:57:04.366000Z2016-07-22T15:57:04.366000ZWei Lihttps://sourceforge.net/u/davidliwei/https://sourceforge.net6f020063779f4678e8cd26eb72a40d26830c1d23<div class="markdown_content"><pre>--- v7
+++ v8
@@ -1,6 +1,7 @@
[TOC]
# Visualization Functions in MAGeCK #
+**We developed a stand-alone visualization tool, VISPR, to visualize CRISPR screening results. See the [paper](http://genomebiology.biomedcentral.com/articles/10.1186/s13059-015-0843-6) and the [VISPR project](https://bitbucket.org/liulab/vispr) for more details.
Since version 0.5, MAGeCK enables a couple of visualization functions. With these features on, MAGeCK helps users better interpret datasets and results, and generates figures and tables that can be directly used in presentations or papers.
</pre>
</div>Aquileo | visualization modified by Wei Li2015-04-27T02:40:11.702000Z2015-04-27T02:40:11.702000ZWei Lihttps://sourceforge.net/u/davidliwei/https://sourceforge.net4f8fad3c8a9b88a1c6790432f5b5777f1b3724f0<div class="markdown_content"><pre>--- v6
+++ v7
@@ -2,9 +2,16 @@
# Visualization Functions in MAGeCK #
-Since version 0.5, MAGeCK enables a couple of visualization functions. With these features on, MAGeCK helps users better interpret datasets and results, and generates figures and tables that can be directly used in presentations or papers:
+Since version 0.5, MAGeCK enables a couple of visualization functions. With these features on, MAGeCK helps users better interpret datasets and results, and generates figures and tables that can be directly used in presentations or papers.
+
+An example of images generated by *plot* command:
<img height="400" src="http://a.fsdn.com/con/app/proj/mageck/screenshots/sample1_summary.png" width="400" rel="nofollow" />
+
+Here is another example of images generated by *count* command:
+
+<img height="400" src="http://a.fsdn.com/con/app/proj/mageck/screenshots/abl_smalllib_stat.png" width="400" rel="nofollow" />
+
The Visualization function has additional software dependencies, but they are easy to install in many operating systems. See [installation](https://sourceforge.net/p/mageck/wiki/install) for more details.
</pre>
</div>Aquileo | visualization modified by Wei Li2015-04-27T02:38:22.935000Z2015-04-27T02:38:22.935000ZWei Lihttps://sourceforge.net/u/davidliwei/https://sourceforge.net2a5ab1aa099746a4871835f621302025e36219eb<div class="markdown_content"><pre>--- v5
+++ v6
@@ -4,7 +4,7 @@
Since version 0.5, MAGeCK enables a couple of visualization functions. With these features on, MAGeCK helps users better interpret datasets and results, and generates figures and tables that can be directly used in presentations or papers:
-
+<img height="400" src="http://a.fsdn.com/con/app/proj/mageck/screenshots/sample1_summary.png" width="400" rel="nofollow" />
The Visualization function has additional software dependencies, but they are easy to install in many operating systems. See [installation](https://sourceforge.net/p/mageck/wiki/install) for more details.
</pre>
</div>Aquileo | visualization modified by Wei Li2015-04-27T02:34:34.657000Z2015-04-27T02:34:34.657000ZWei Lihttps://sourceforge.net/u/davidliwei/https://sourceforge.net43e3eb3e888c2c9f88225069b0666937fde9feac<div class="markdown_content"><pre>--- v4
+++ v5
@@ -2,7 +2,9 @@
# Visualization Functions in MAGeCK #
-Since version 0.5, MAGeCK enables a couple of visualization functions. With these features on, MAGeCK helps users better interpret datasets and results, and generates figures and tables that can be directly used in presentations or papers.
+Since version 0.5, MAGeCK enables a couple of visualization functions. With these features on, MAGeCK helps users better interpret datasets and results, and generates figures and tables that can be directly used in presentations or papers:
+
+
The Visualization function has additional software dependencies, but they are easy to install in many operating systems. See [installation](https://sourceforge.net/p/mageck/wiki/install) for more details.
</pre>
</div>